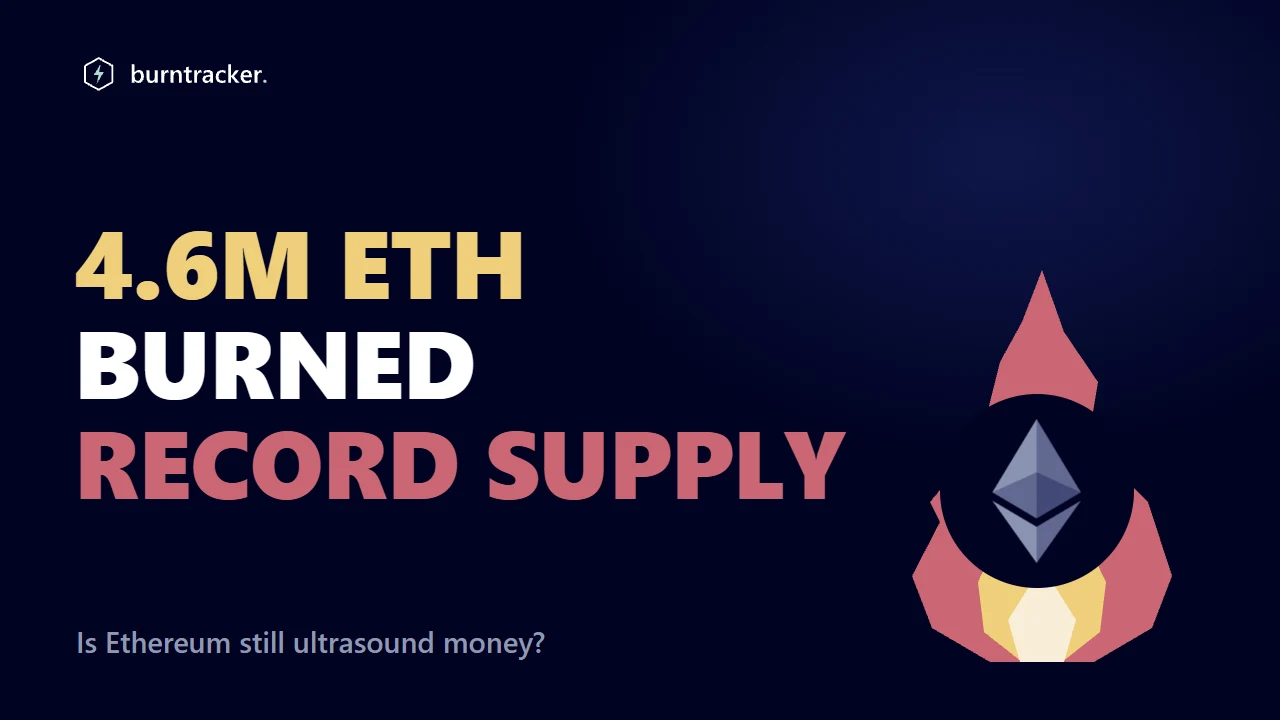
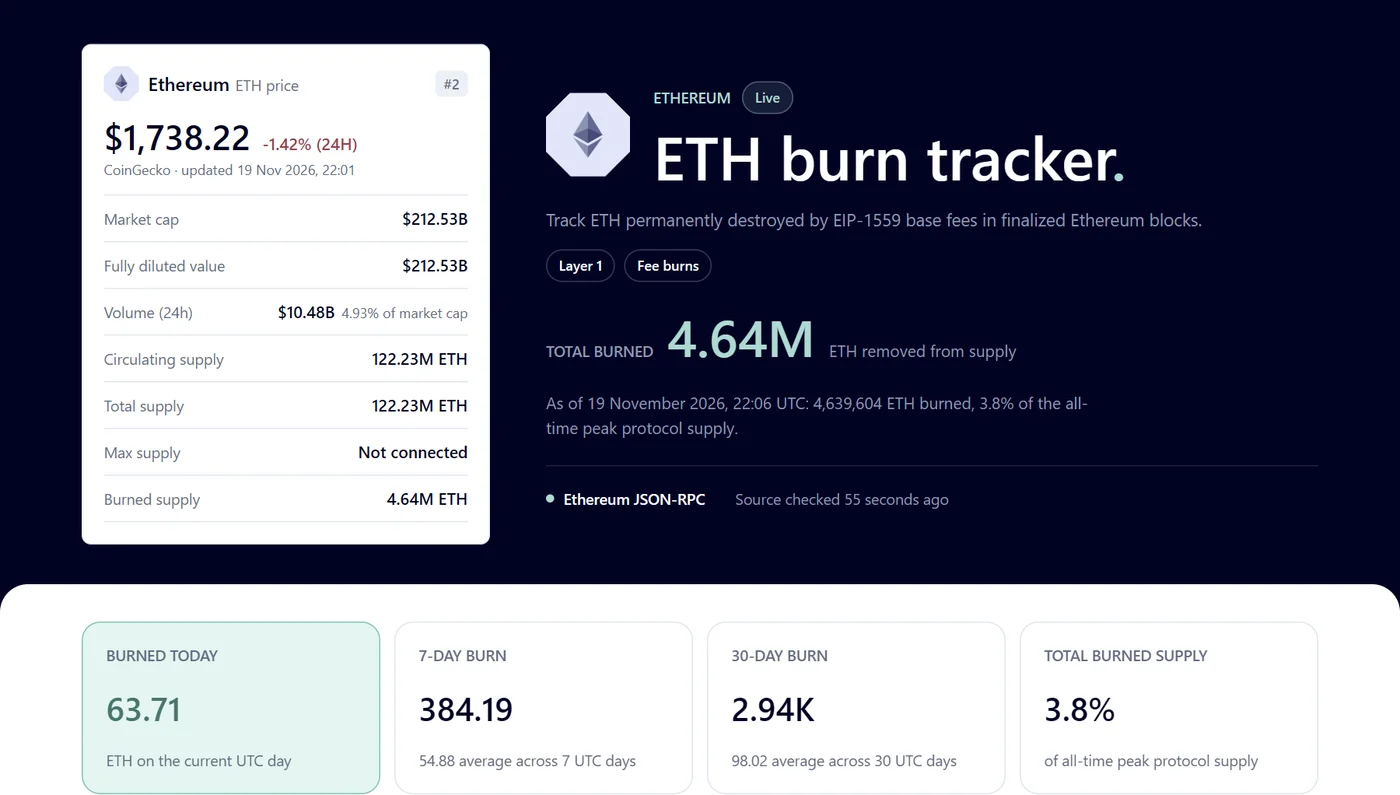
For about a year and a half, Ethereum’s boldest slogan was simply true. The network destroyed ETH faster than it created it, the supply shrank, and fans called it “ultrasound money”. The burn never stopped: the Ethereum burn tracker has counted about 4.6 million ETH destroyed since August 2021. Yet as of 19 November 2026, there is more ETH than ever before. The rule didn’t change; what it has to burn did.
How does Ethereum burn ETH?
Through its fees. Every transaction pays a base fee, set by the network and the same for everyone in a block, plus an optional tip for the validator who includes it. Since the London upgrade of August 2021, a rule called EIP-1559 destroys the base fee instead of paying it to anyone.
The base fee rises when blocks are full and falls when they aren’t. So the burn mirrors demand for space on Ethereum’s main chain: a busy network burns a lot, a quiet one almost nothing.
Nobody decides how much is burned, so nobody can promise it. EIP-1559 burns the base fee to stop block producers pushing it up and pocketing it; a shrinking supply was a side effect, not a target.
How much ETH has been burned?
About 4.6 million ETH, but most of it years ago. More than half went in the 13 months between London and the Merge, when Ethereum was still mined. The record month was January 2022, with nearly 400,000 ETH burned.
After that the burn faded, came back in the busy spells of 2023 and early 2024, then dropped away twice: after March 2024, and again in early 2025. In October 2026 it removed about 3,200 ETH in the whole month. That’s roughly what six hours burned in January 2022.
So the big total describes the past. Today the burn adds a few thousand ETH a month to it, sometimes less.
Was ETH ever ultrasound money?
Yes, for about a year and a half. The phrase plays on “sound money”, a currency whose supply can’t be inflated away. Ultrasound money would go one better, with a supply that shrinks: ultrasound.money, the site named after the idea, calls it an Ethereum meme about “the likely decrease of the ETH supply”.
That only works if the burn beats new issuance, the ETH the network creates to pay validators. Before the Merge in September 2022, mining created far more than the burn could destroy, even at its peak. The Merge cut new issuance by about 88%, and suddenly a busy network was enough.
From the Merge to April 2024, the supply fell by about 460,000 ETH. In 2023 it shrank on more than two days out of three. Then the line turned. It passed its Merge level again in February 2025 and has kept climbing; in 2026 it hasn’t fallen on a single day.
So is Ethereum deflationary? Not now. It was from late 2022 to early 2024, and it could be again, but only if the burn comes back.
Why did the burn dry up?
Because using Ethereum got cheaper, by design. The burn only reaches fees paid on the main chain, and much of the activity has moved off it, to layer-2 networks such as Arbitrum, Base and Optimism. They bundle many transactions and post the result back to Ethereum, so each one burns a small fraction of what it would on the main chain.
The Dencun upgrade of March 2024 made layer 2s much cheaper still. It gave them their own lane for data, called blobs, with a separate fee that has stayed tiny. The supply hit its low about three weeks later.
Then, during 2025, validators doubled the room in each block, raising the gas limit in steps to 60 million gas. More room for the same demand means a lower base fee, and a smaller burn.
None of this is a fault. Cheaper transactions were the point of these upgrades. A smaller burn is the price, and the supply chart is what that price looks like.
What does it mean if you hold ETH?
Mainly that the supply is growing again, though slowly. Over the past year about a million new ETH came into existence, net of the burn. That’s growth of roughly 0.8% a year.
The new ETH goes to validators as rewards. So if you stake, you receive a share of it; if you don’t, your slice of all ETH gets a little thinner each year. The burn no longer does much to change that.
What would bring ultrasound money back? By our estimate, the network now creates about 2,800 ETH a day, so the burn would have to match that, week after week. That’s roughly 30 times its average over the last month. It isn’t unthinkable: in 2023 the burn averaged about 3,000 ETH a day. But it would take that kind of demand returning to the main chain, not a new rule.
The burn still does its first job, keeping Ethereum’s fees honest. It just doesn’t shrink the supply any more.
What to watch next
- The daily burn. Weeks at around 2,800 ETH a day, not a few busy days, would turn the supply down again. The tracker’s daily totals will show it first.
- Where the activity goes. Big launches and market rushes on the main chain push the base fee up; more traffic moving to layer 2s pulls it down.
- Bigger blocks. Any further rise in the gas limit gives the same demand more room, which lowers the base fee.
- How much ETH is staked. New issuance grows with the amount staked, so it moves the line the burn has to beat.
How we counted
The tracker reads every finalized Ethereum block since the London upgrade (block 12,965,000) and multiplies the block’s base fee per gas by the gas it used. As of 21:51 UTC on 19 November 2026, that adds up to 4,639,603 ETH over 13,486,741 blocks. It counts the main-chain base fee only. Tips aren’t burned, and blob fees, which are burned too, aren’t in the total: by growthepie’s data they came to about 4,700 ETH from Dencun to 18 November 2026. The tracker doesn’t subtract new issuance either.
Supply figures are growthepie’s daily ETH supply series (data: ultrasound.money), licensed CC BY 4.0, read and rounded by cryptoburntracker.com. “New ETH” in this article is our estimate: the change in supply plus BurnTracker’s burn over the same days. For the year to 18 November 2026 that is 1,009,179 + 20,894 = 1,030,073 ETH, about 2,820 a day. At today’s price of $1,737.28 the burned ETH would be worth about $8.1 billion, but most of it burned at other prices, so that isn’t money anyone spent. Nothing here is a price forecast.
Check it yourself
- Recompute one block. On Etherscan, a block page shows Base Fee Per Gas, Gas Used and Burnt Fees; the burnt fees are the first two multiplied. Try block 26,301,015, a busy block of 29 October 2026 that burned 12.23 ETH.
- Look at the supply. growthepie’s ETH supply page shows the daily series used here, with the dip after the Merge and today’s record.
- Compare with the tracker. The ETH tracker lists the daily totals and the largest block burns, and its methodology states the formula and what is left out.
The burn still runs, block by block, on the Ethereum burn tracker. If it ever outruns new issuance again, the daily totals there will show it before the slogan comes back.
Informational only, not financial advice.Sources
- BurnTracker: the ETH tracker (total, daily totals, largest and latest block burns) and its methodology, read on 19 November 2026. Price: CoinGecko, in BurnTracker’s market snapshot of the same day ($1,737.28).
- ETH supply: growthepie’s daily ETH supply series (data: ultrasound.money), licensed CC BY 4.0, read and rounded by cryptoburntracker.com.
- The meaning of “ultra sound money”: ultrasound.money, read on 19 November 2026.
- Protocol: EIP-1559 (base fee, tip and burn); EIP-4844 (blobs and the blob fee); ethereum.org on gas and fees, the Merge, ETH issuance and the history of upgrades (London, the Merge, Dencun); the Ethereum Foundation’s Fusaka announcement (the 60 million gas limit).
- Blob fees: growthepie, data availability fees paid for Ethereum blobs, daily, CC BY 4.0, added up by cryptoburntracker.com from 14 March 2024 to 18 November 2026.
- Recomputing a block: Etherscan, block 26,301,015.