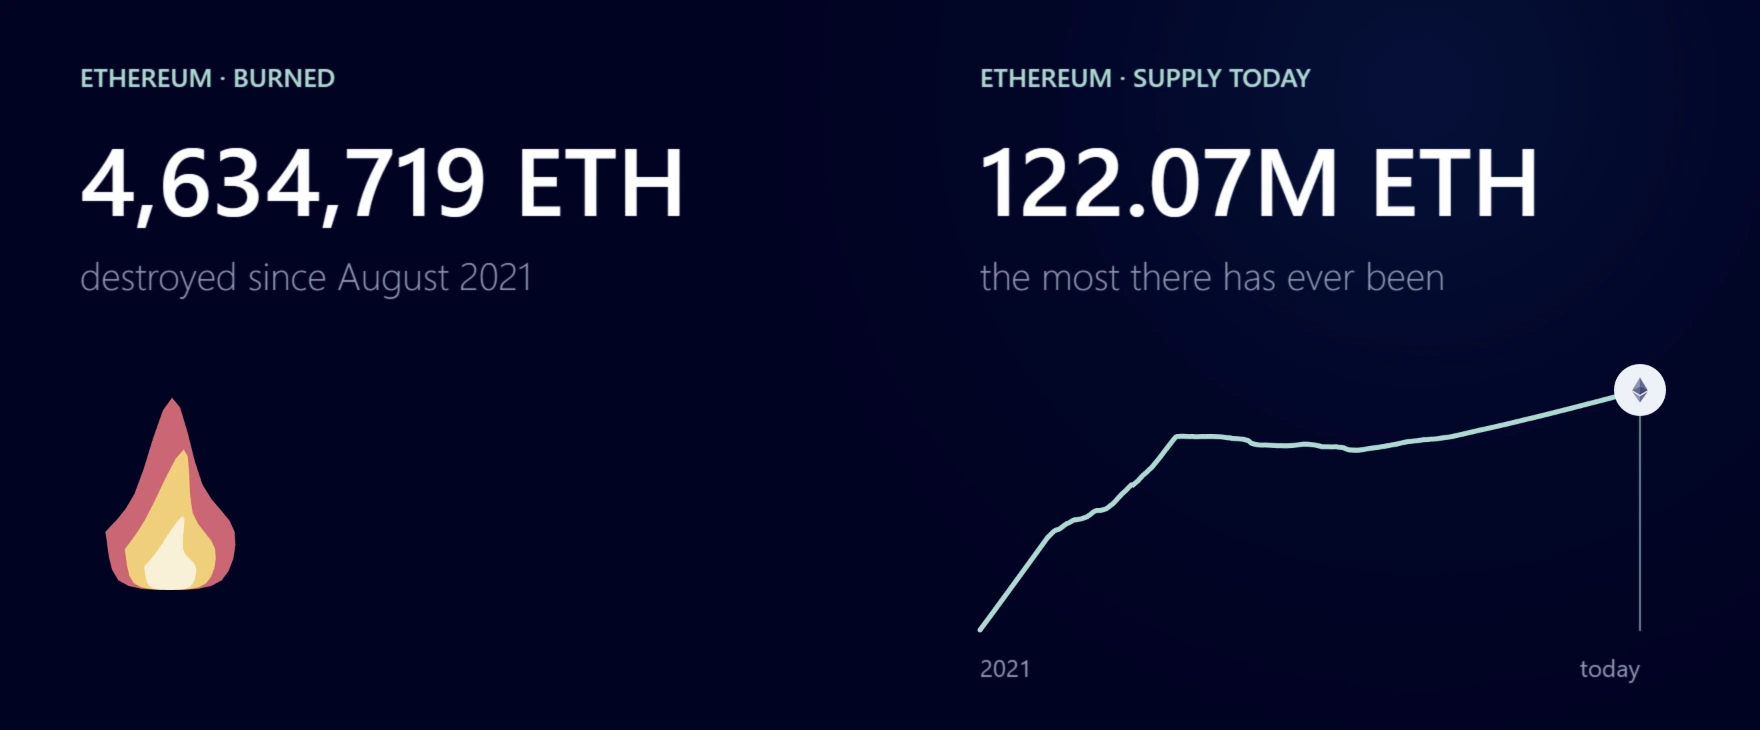
Ethereum has destroyed more than 4.6 million ETH since August 2021. And yet there is more ETH today than ever before. Both are true, and the reason is the most useful thing to know about token burns: a burn tells you what left the supply, not what came in.
To see how both can be true, we need to be precise about three things: what a burn is, what it is not, and what a burn total can and can’t tell you.
What a token burn is
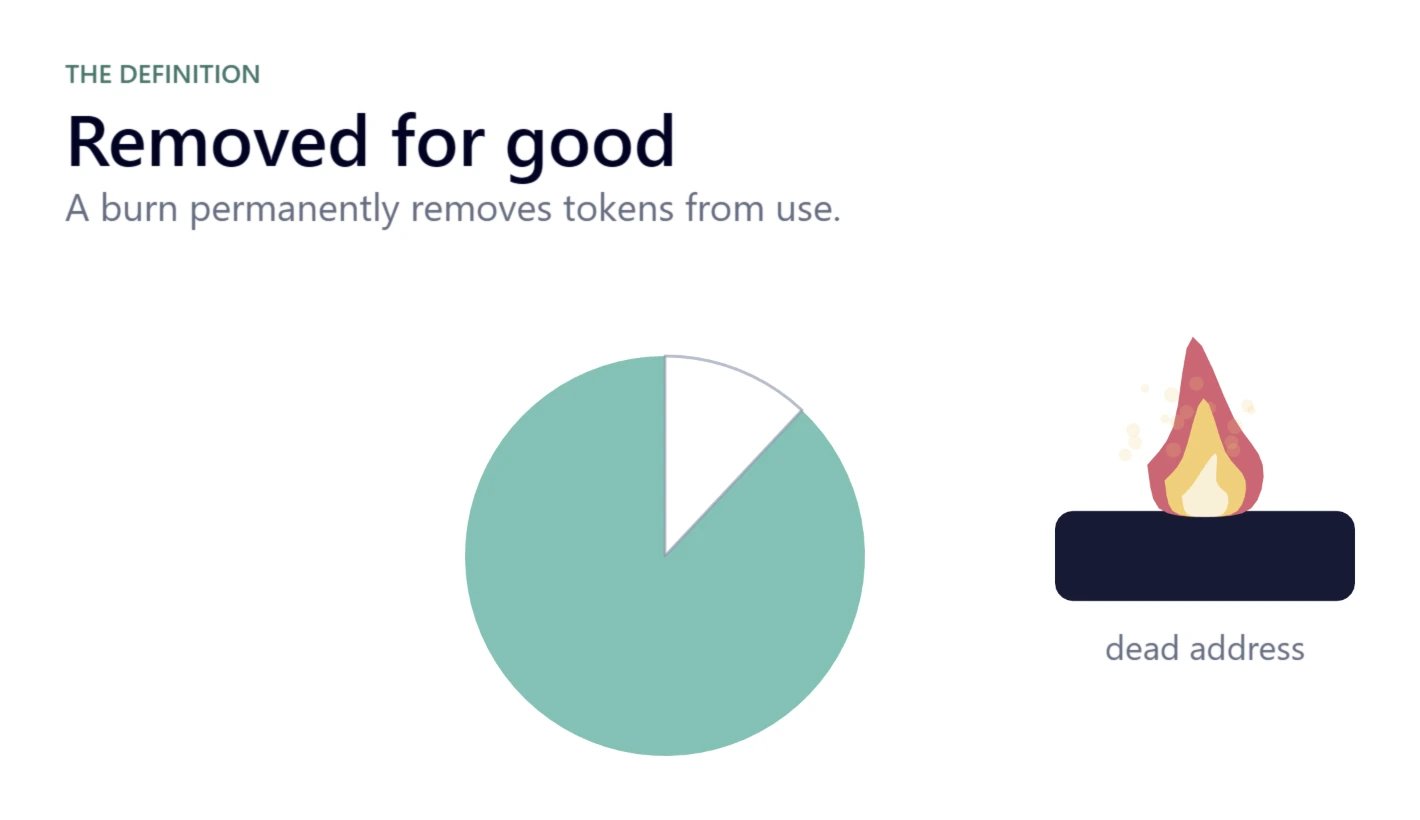
A token burn permanently removes tokens from use. The burned tokens stay in the blockchain’s history, but nobody can ever spend them again.
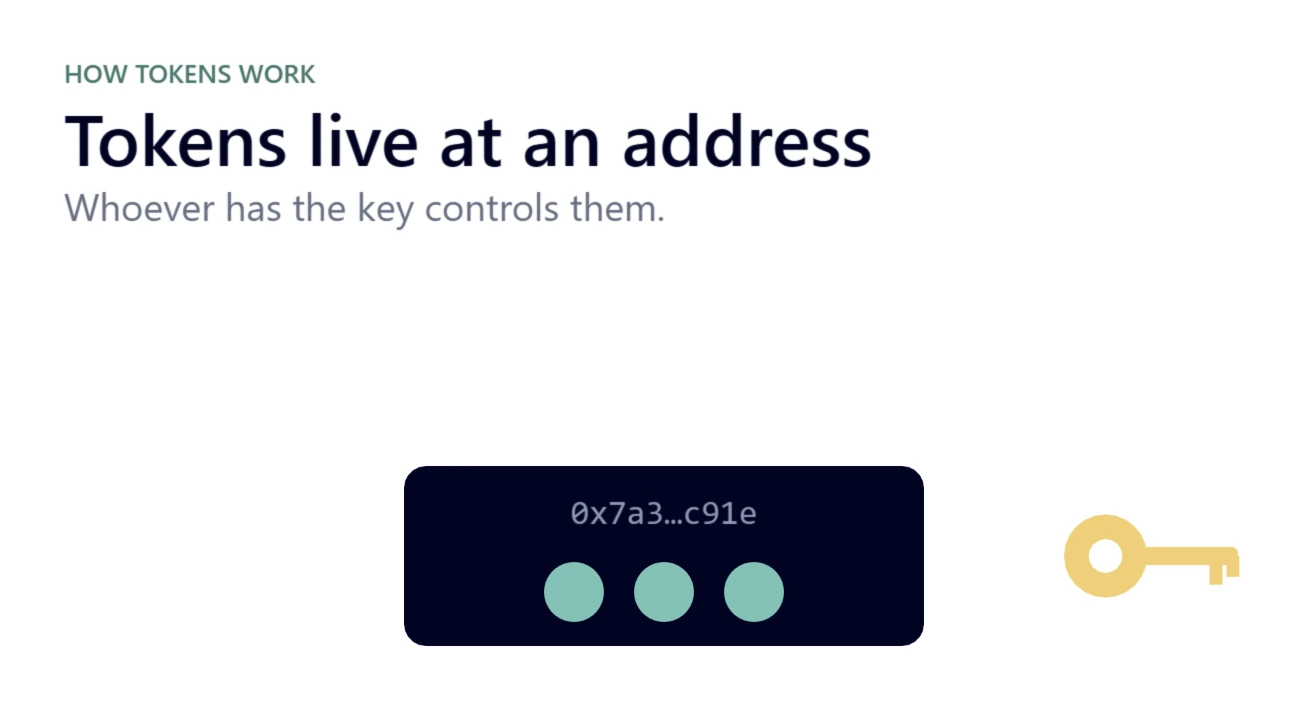
To see why that’s possible, start with how tokens work. Your tokens aren’t files on your phone. They’re a balance recorded on a blockchain, held by an address. To move them, you need that address’s private key, the secret that signs every transaction. Whoever has the key controls the tokens.
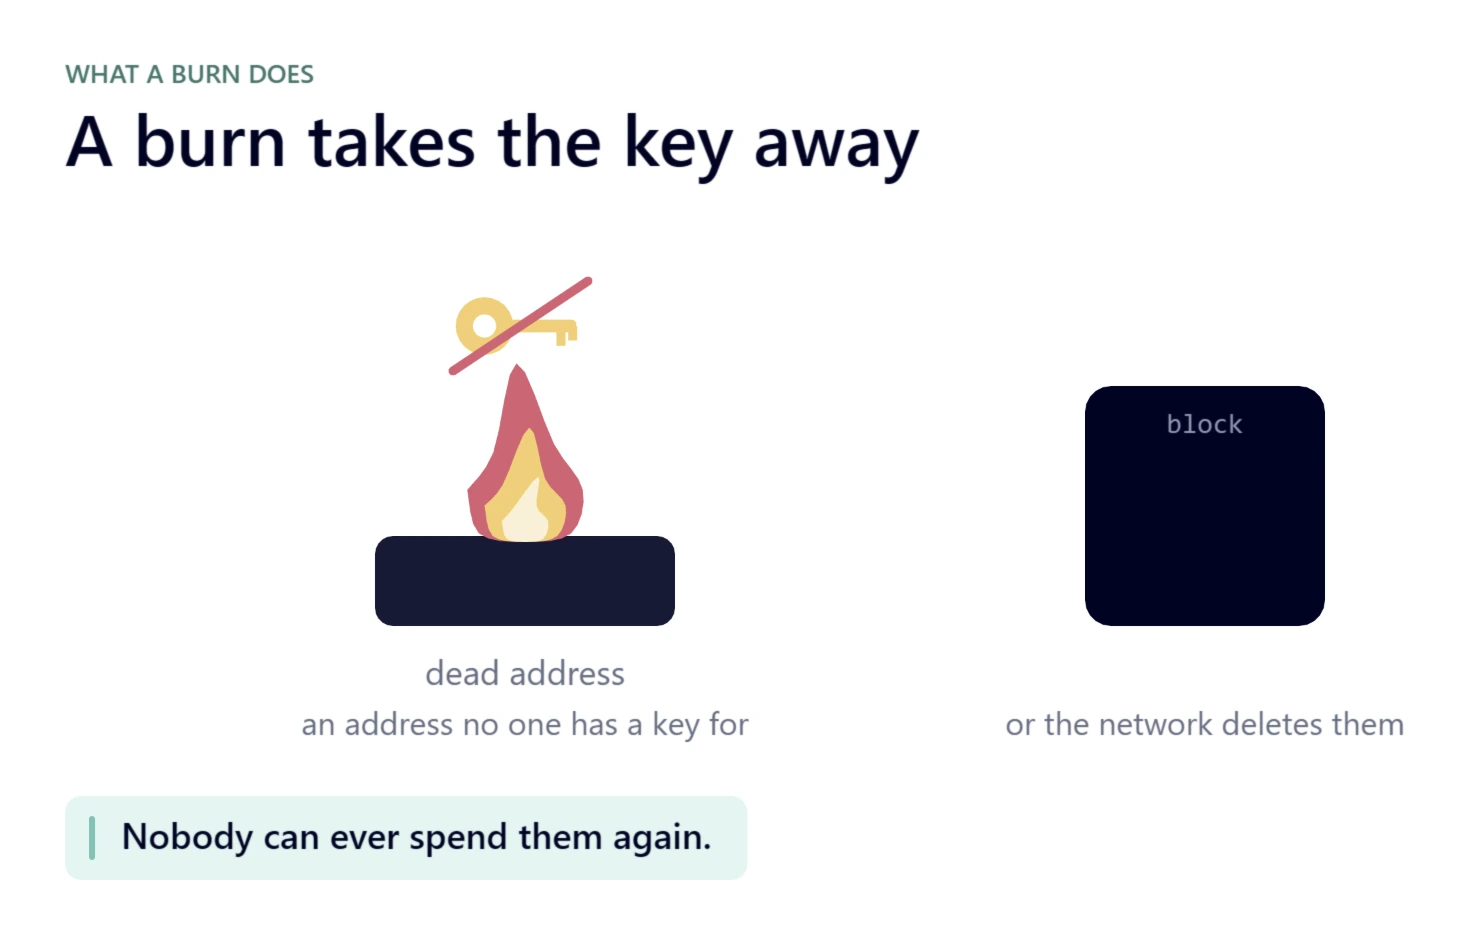
A burn takes that control away for good. It works in one of two ways:
- The tokens go to an address that no one is known to have a key for. This is called a dead address or burn address. The tokens are still recorded there, but nobody can sign a transaction to move them out.
- Or the network deletes them outright. The protocol’s own rules destroy the tokens, and they stop existing.
Either way, nobody can ever spend them again: not the project, not an exchange, not you.
What a burn is not
Plenty of token moves look like burns in a headline but aren’t. Many projects keep a treasury: a wallet that holds the project’s own tokens, to spend later. Others lock tokens in a contract that only releases them on a set date.
In both cases, someone still controls those tokens. They’re only parked, and they can come back.
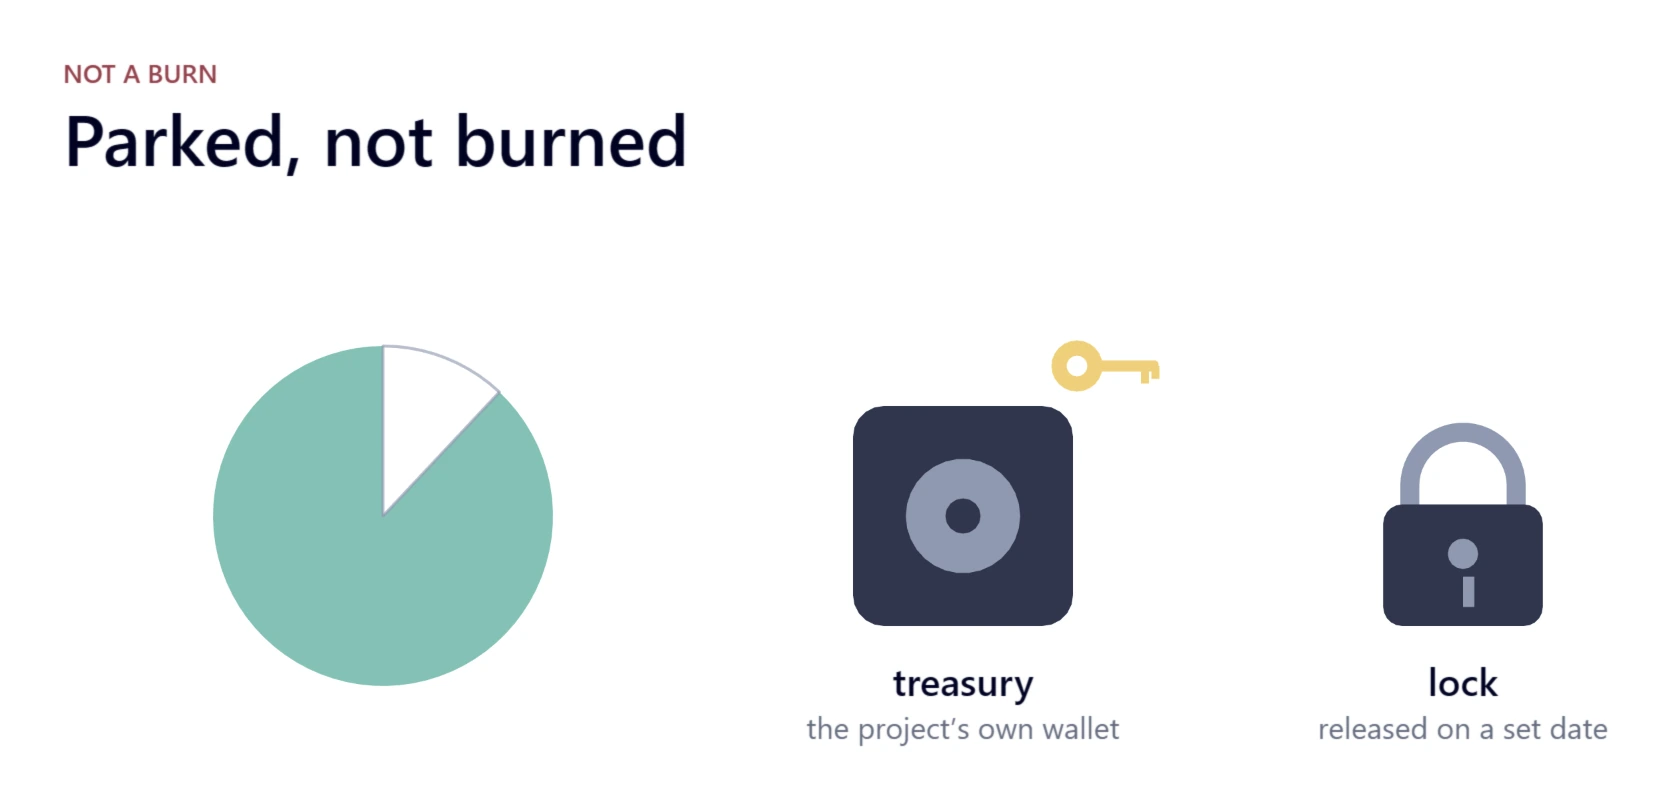
The same goes for buying. A project that buys its own tokens back hasn’t burned anything yet. The purchase becomes a burn only when the tokens it bought are permanently removed.
If someone can still move the tokens, they aren’t burned.
Three ways tokens get burned
Burns come in three main forms. Each works differently, and each has a well-known real example.
1. Burn address: Shiba Inu
The simplest burn is a transfer: you send the tokens somewhere they can never leave. Shiba Inu’s history holds the most famous example.
The SHIB token contract was deployed on 31 July 2020 with 1,000 trillion SHIB. Within days, about half of all the tokens, some 495 trillion SHIB, were sent to Ethereum’s co-founder, Vitalik Buterin.
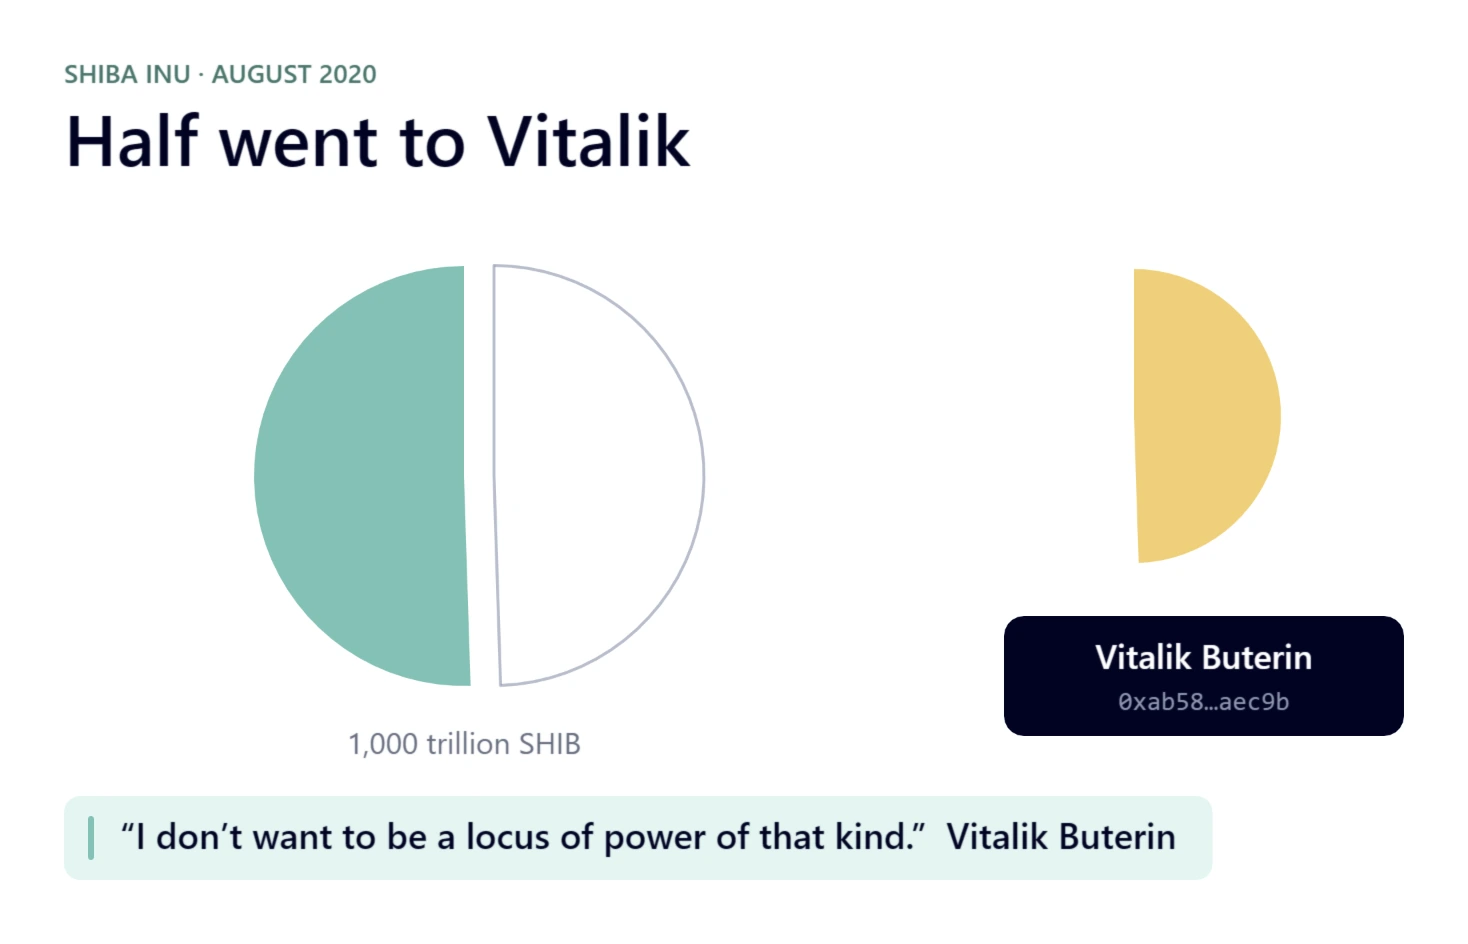
He hadn’t asked for them. In a note he left on the blockchain, he wrote that he didn’t want to be “a locus of power of that kind.”
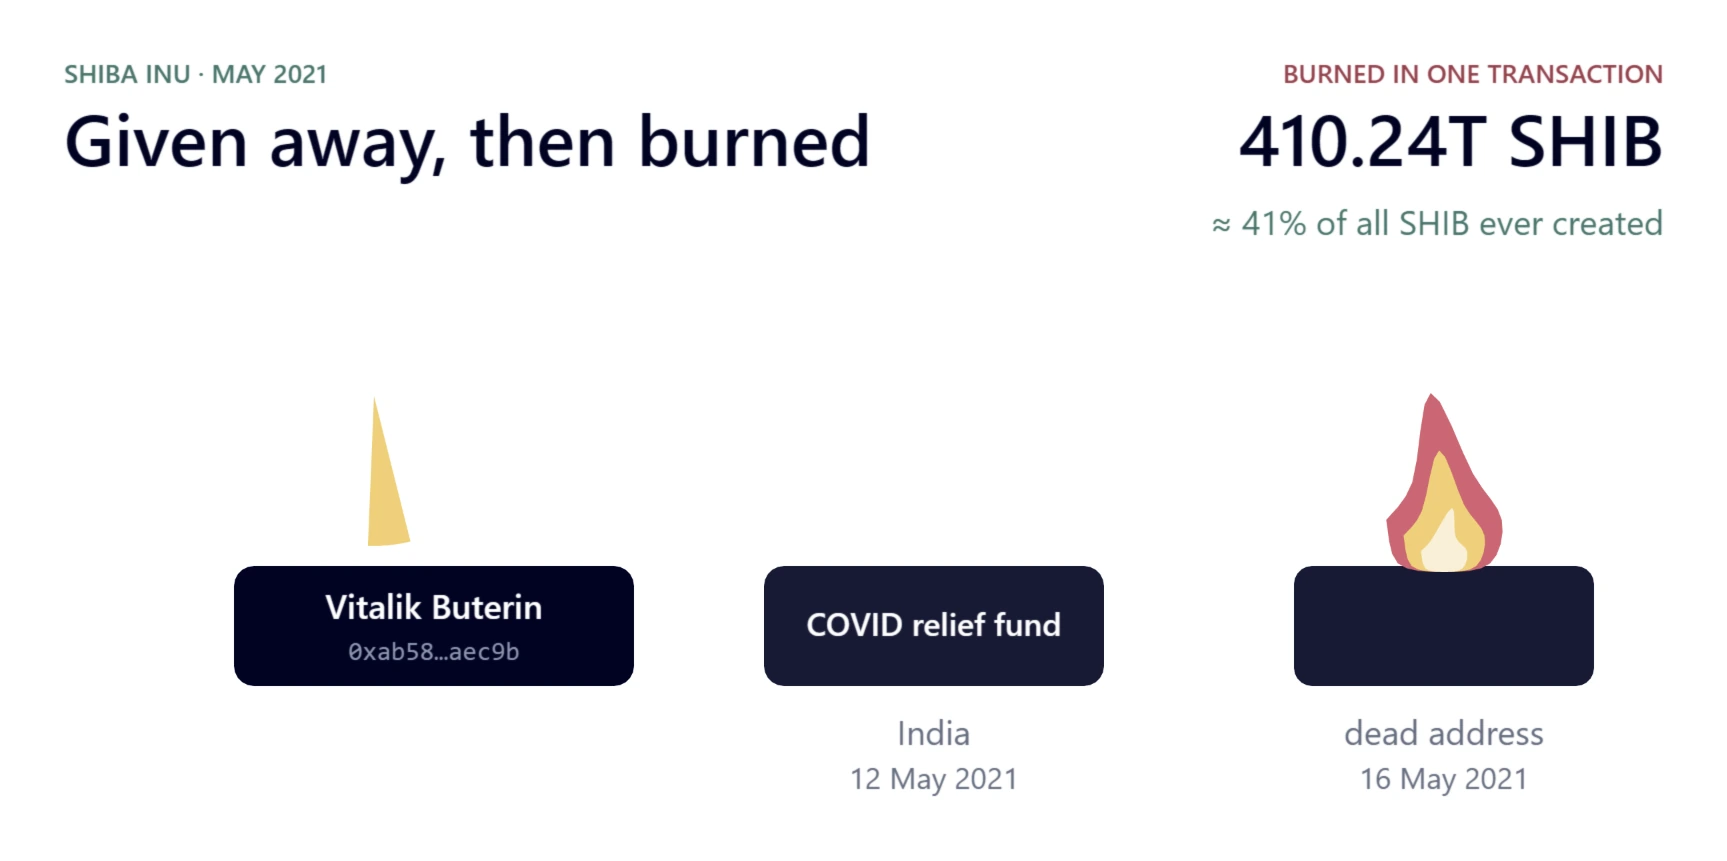
In May 2021, he acted. On 12 May, he gave about 50 trillion SHIB to the India Covid-Crypto Relief Fund. Four days later, on 16 May at 21:48 UTC, he sent 410,241,996,771,871 SHIB, 90% of what he had left, to a dead wallet, in one single transaction. That one transfer removed about 41% of all the SHIB that was ever created.
Now look at SHIB’s burns over time. As of 25 September 2026, BurnTracker counts 410.76 trillion SHIB burned in total. About 99.9% of it is that single transfer. Everything burned since then barely shows on the same scale.
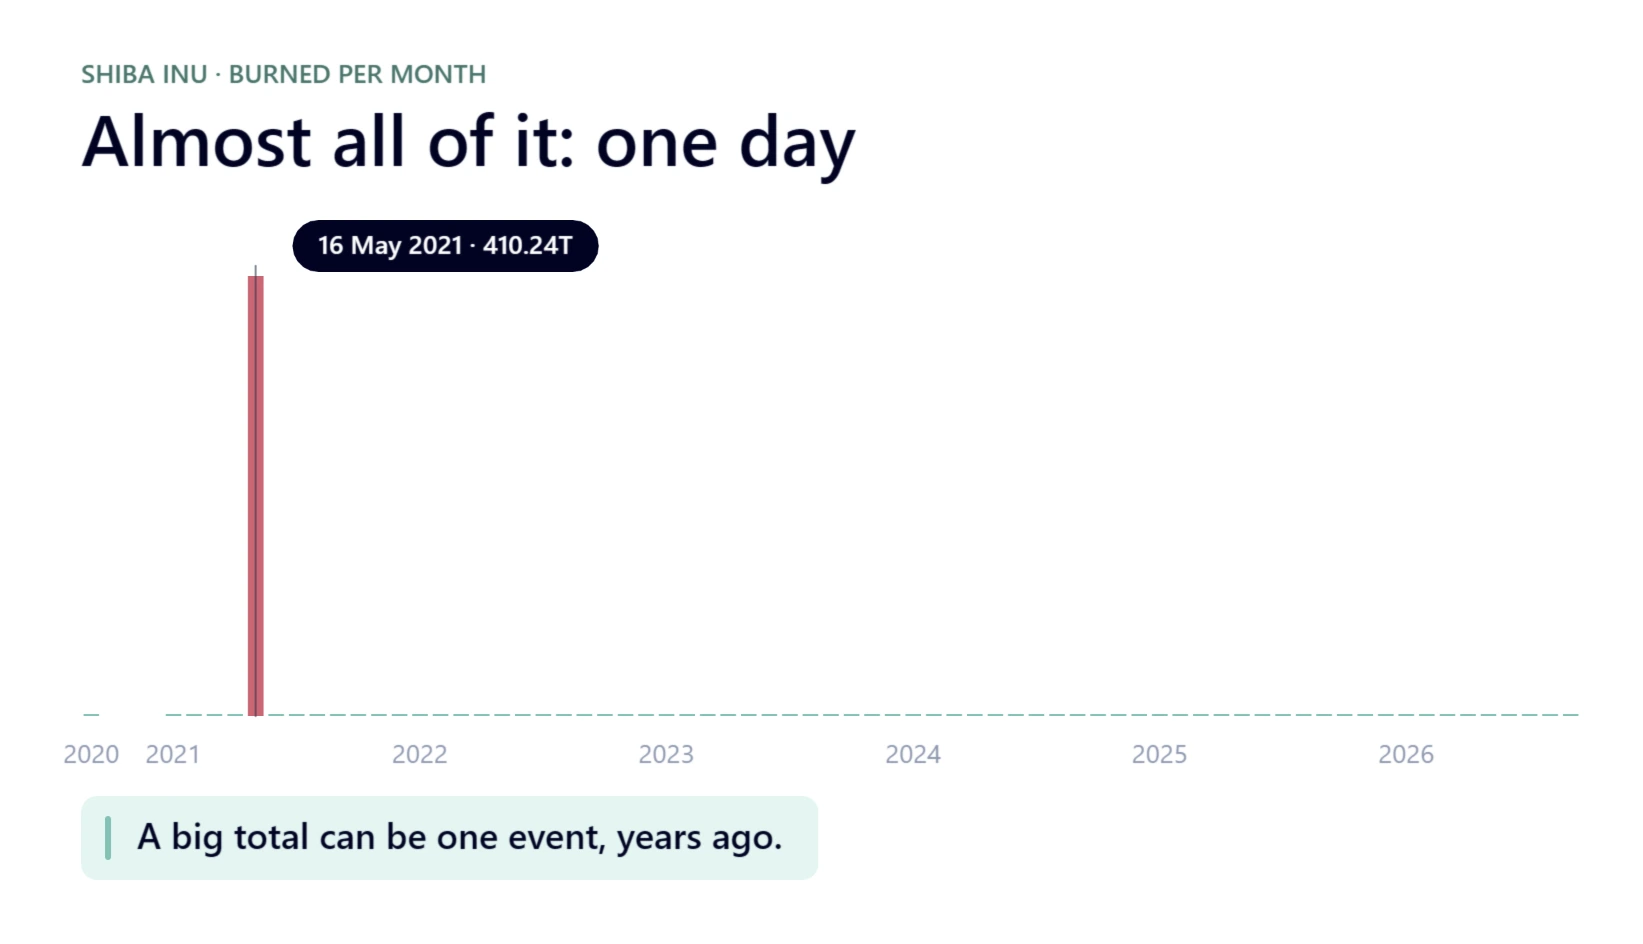
So a big burn total doesn’t always mean a lot is still being burned. It can be one event, years ago.
2. Protocol burn: Ethereum
In a protocol burn, nobody sends anything anywhere. The network itself destroys tokens under its own rules.
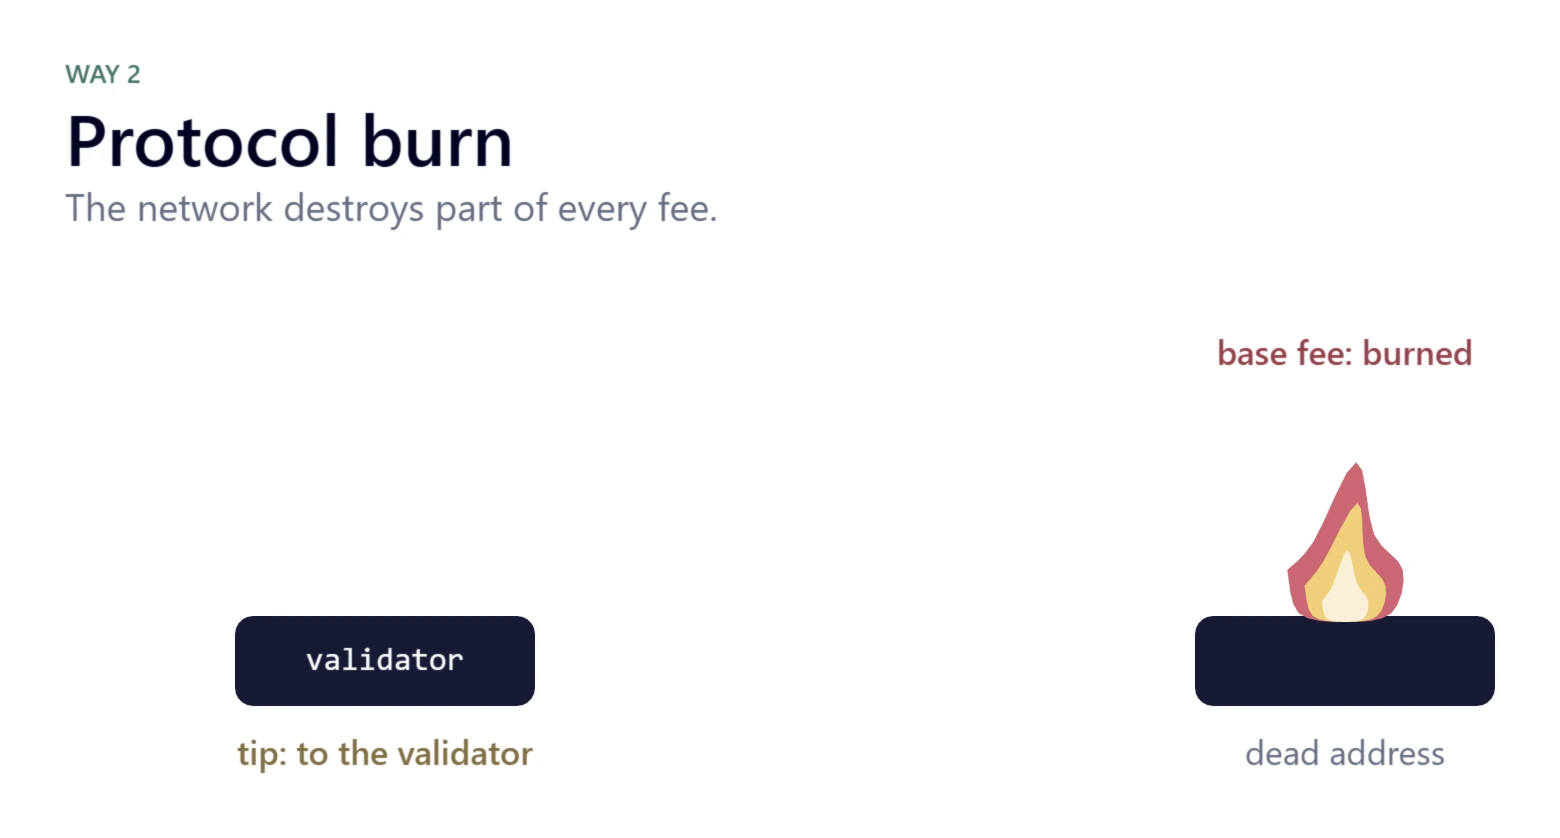
Ethereum has done this since the London upgrade on 5 August 2021, which introduced EIP-1559. Every transaction pays a fee in two parts. The base fee is burned: it isn’t paid to anyone, it simply stops existing. The rest, the priority fee or tip, goes to the validator who adds the transaction to a block.
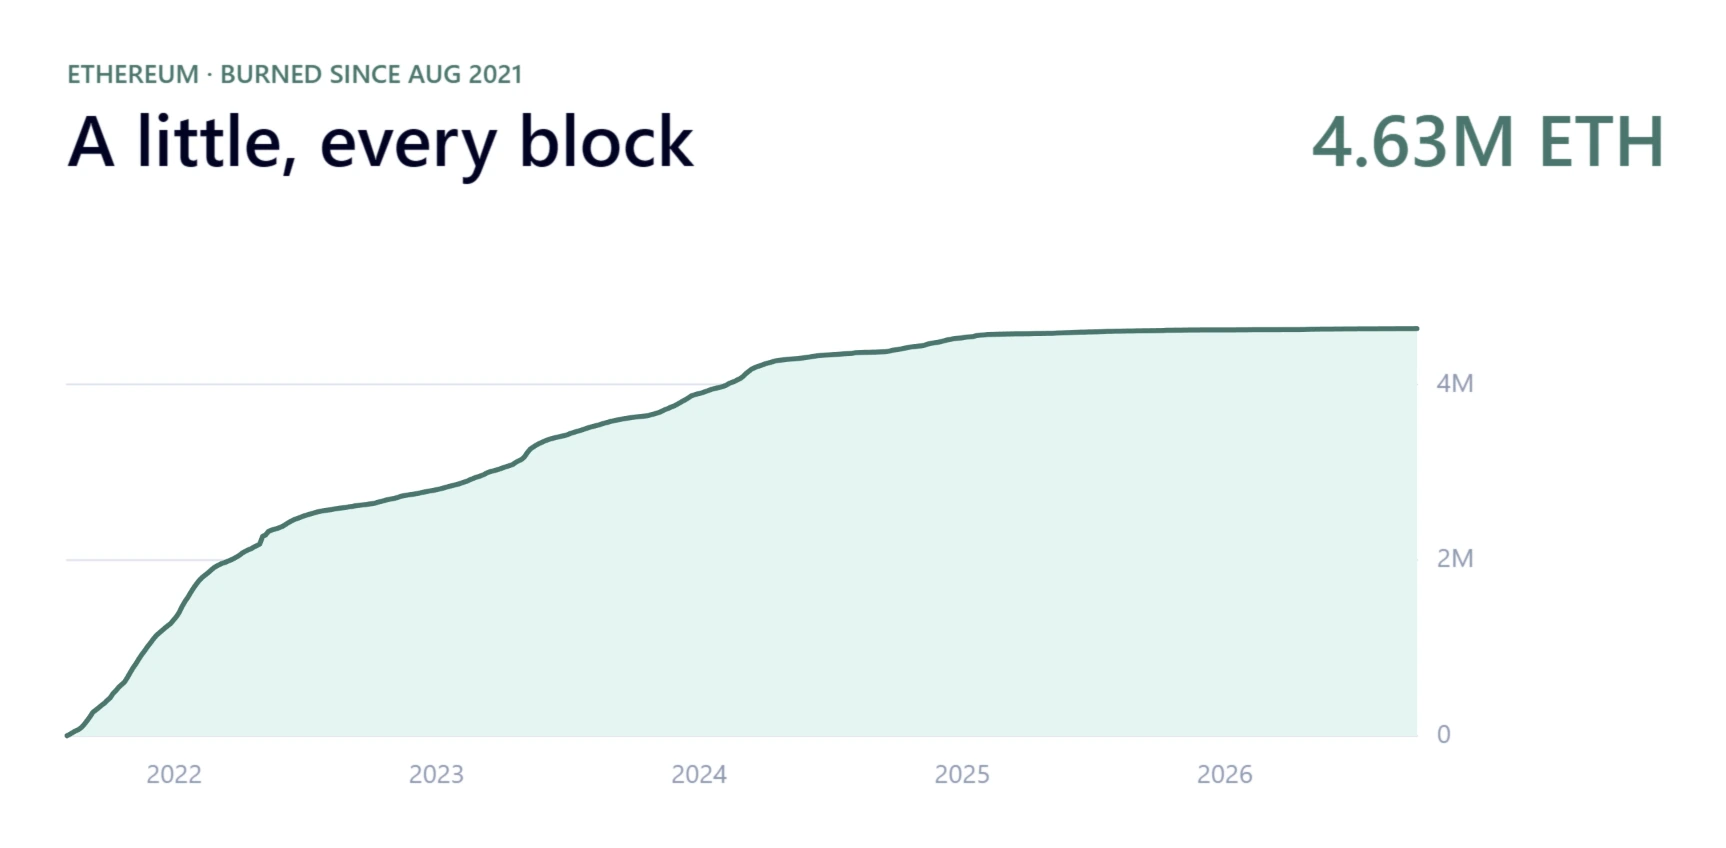
Each block burns only a little. But every block burns some, and it adds up. In just over five years, Ethereum has burned 4,634,719 ETH, as of 25 September 2026. BurnTracker counts it block by block: for every finalized block, the base fee per unit of gas times the gas used.
3. Buyback and burn: Hyperliquid
The third way involves the market. Tokens are bought, then removed for good. Remember: the purchase alone isn’t the burn. The removal is.
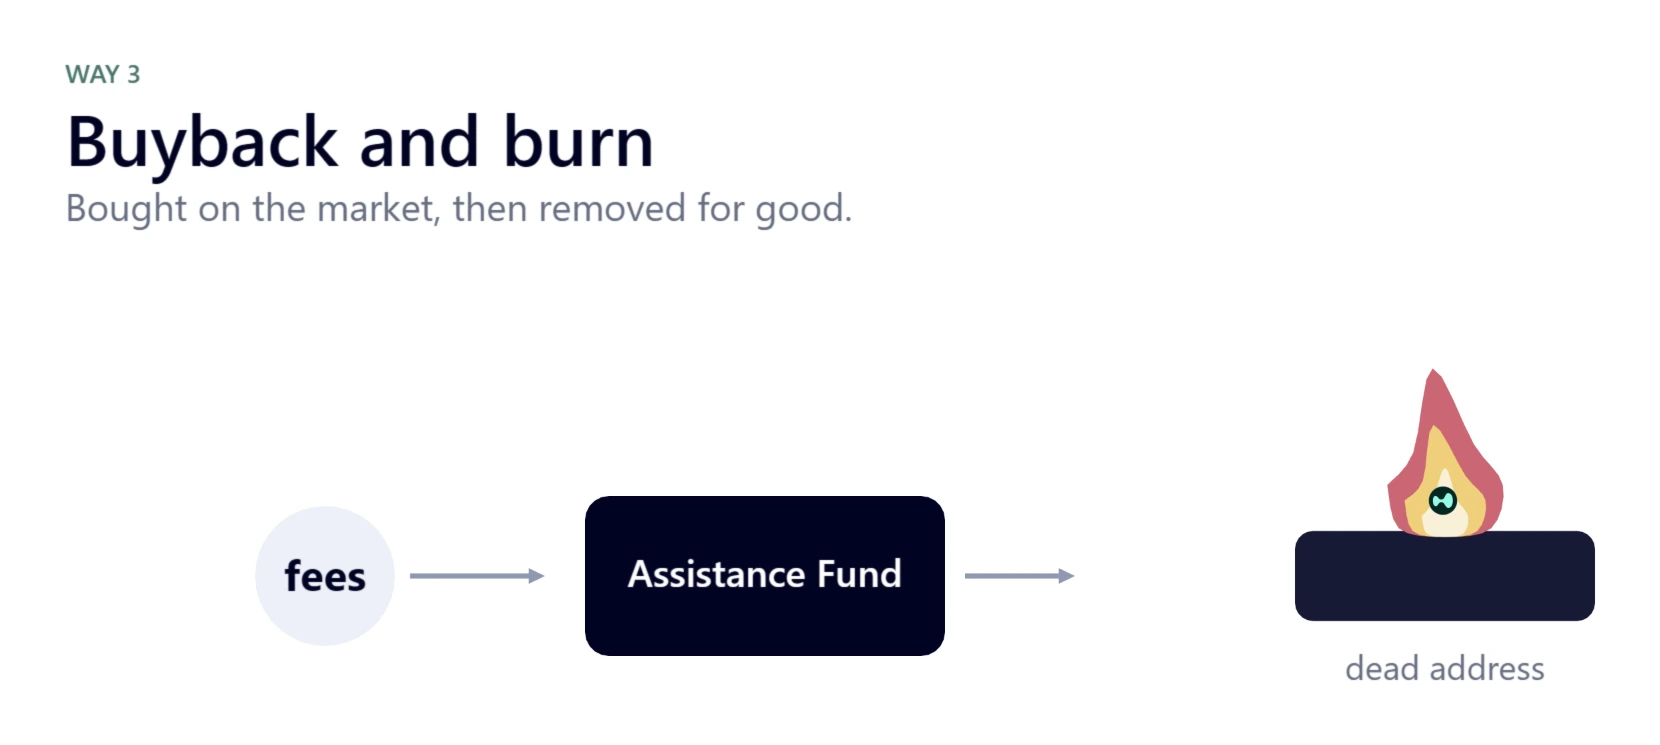
Hyperliquid works like this. Its Assistance Fund converts trading fees into HYPE automatically, and Hyperliquid’s documentation says that HYPE is burned, removed permanently from both the circulating and the total supply.
Because it runs on fees, the burn follows trading activity: busy markets burn more, quiet ones less.
- Over the last 30 days, it burned about 23 thousand HYPE a day. At today’s price, that’s around $2.2 million a day.
- Its busiest day was 10 October 2025: 517,563 HYPE. That was worth about $22 million at the time. At today’s price, the same amount would be worth about $48 million.
- In total, BurnTracker counts about 47.8 million HYPE burned as of 25 September 2026. At today’s price, that’s about $4.5 billion.
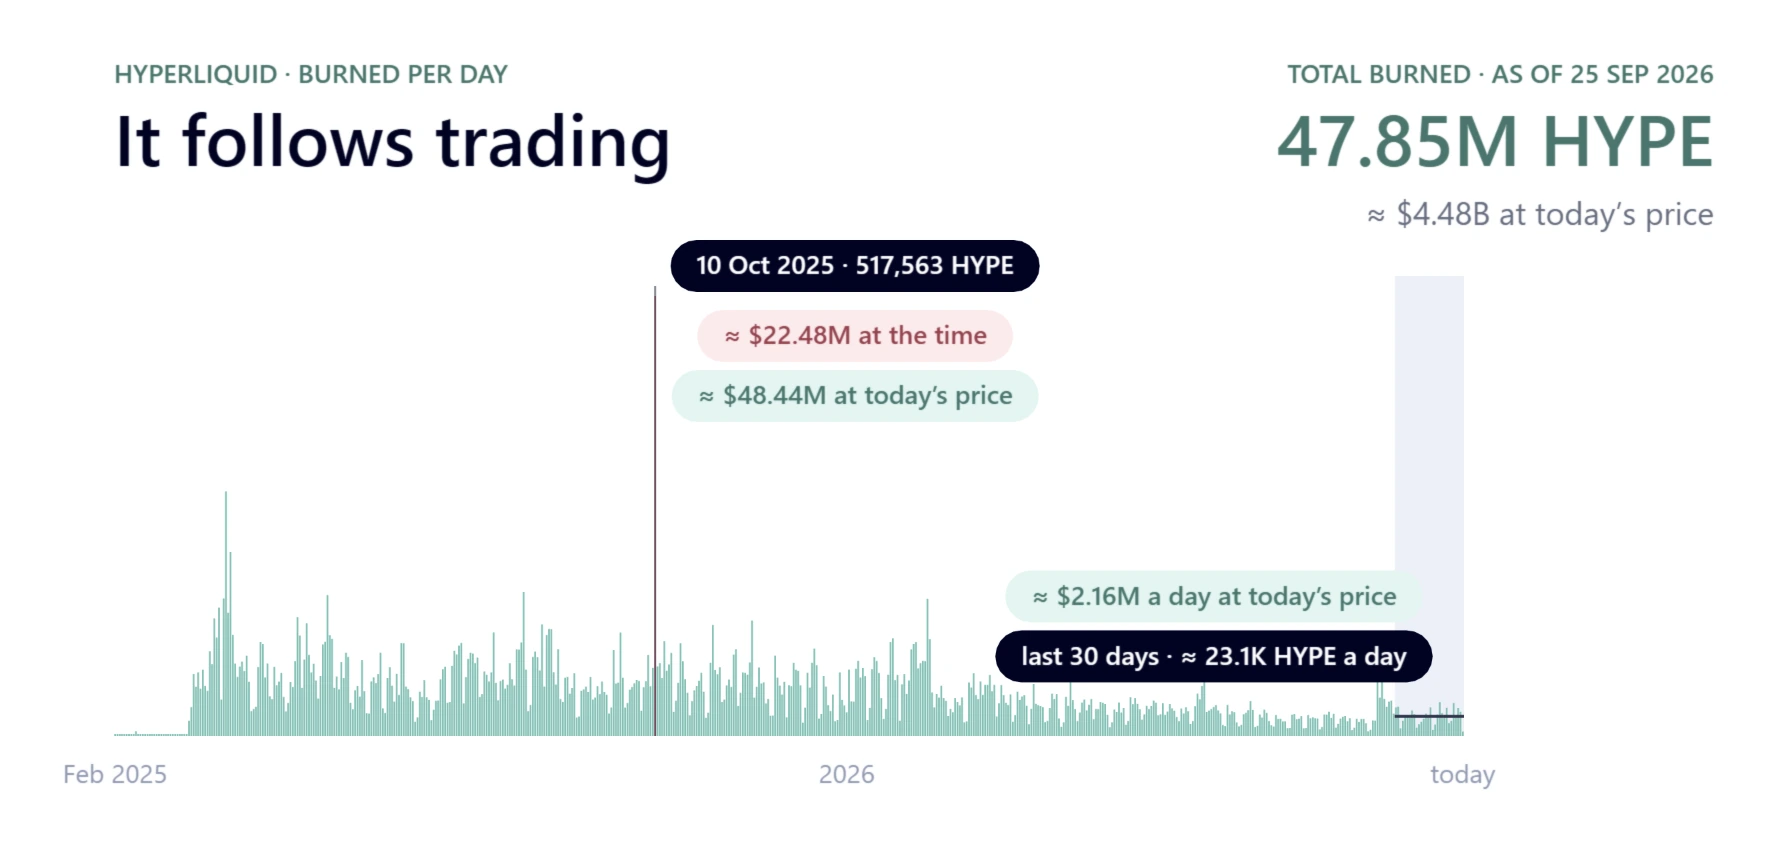
One note on those dollar figures. A value “at today’s price” multiplies the burned tokens by the latest price. It isn’t the money spent on the burn, and it isn’t what the tokens were worth when they were burned.
Does a burn shrink the supply?
Now for the question from the start. If a token burns, does its supply go down? Not necessarily.
Think of the supply as water in a bathtub. New tokens are the tap. Burns are the drain. If the drain is bigger than the tap, the level falls. If the tap is bigger, the level still rises, even while tokens are being burned.
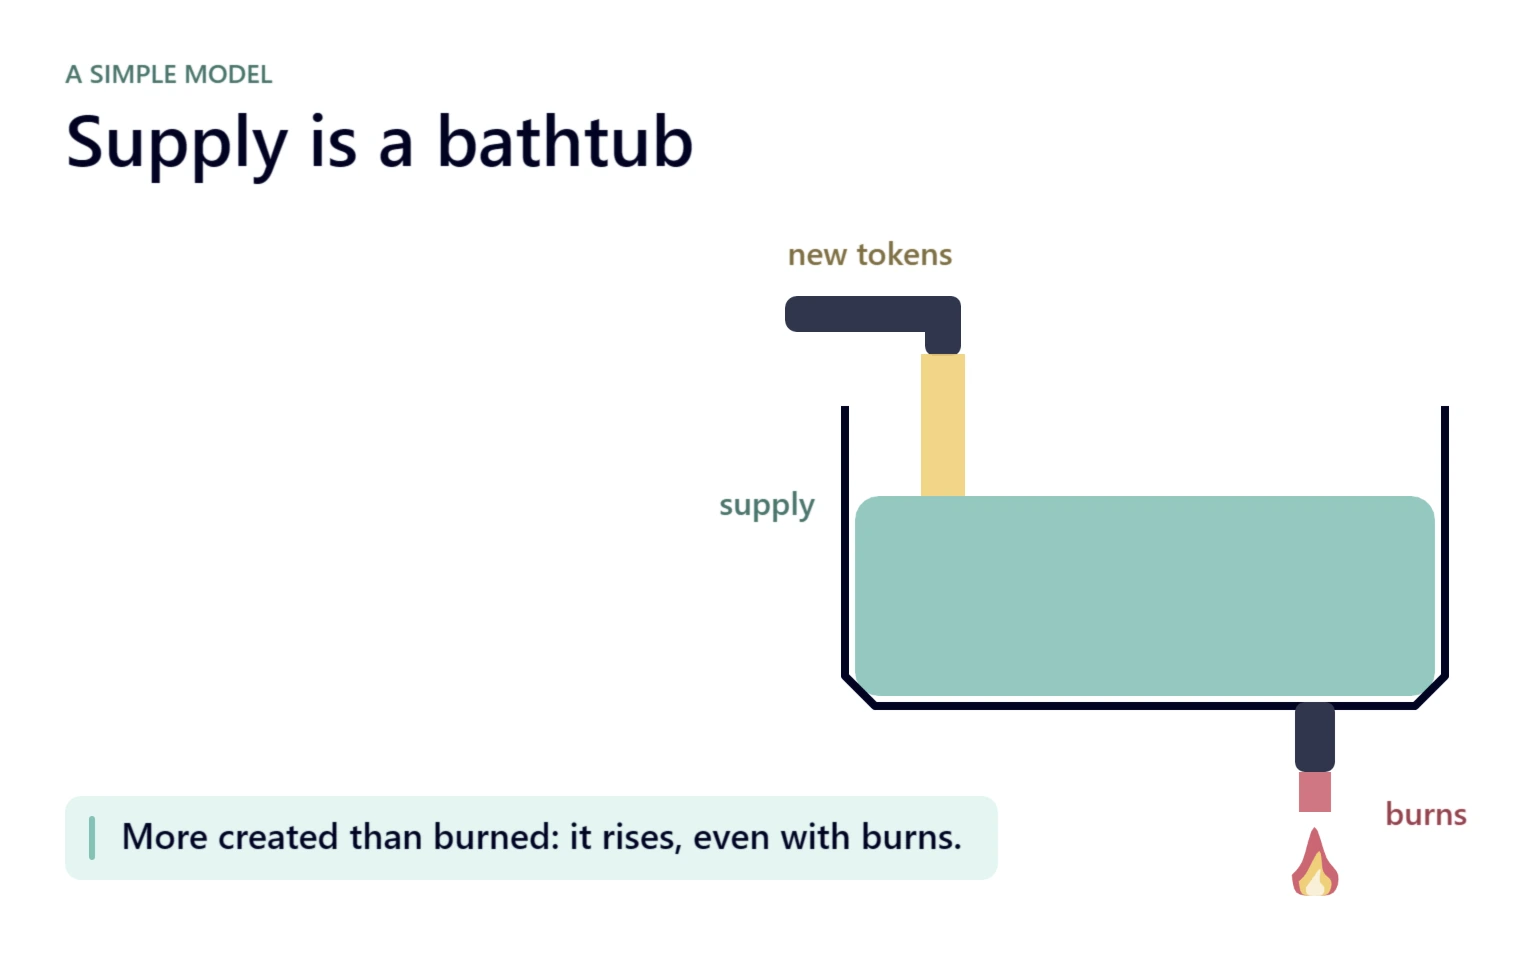
A network creates 1,000 new tokens in a day and burns 600. That’s a busy day for burns, and the supply still grows by 400 tokens.
A tank, a river or a mint
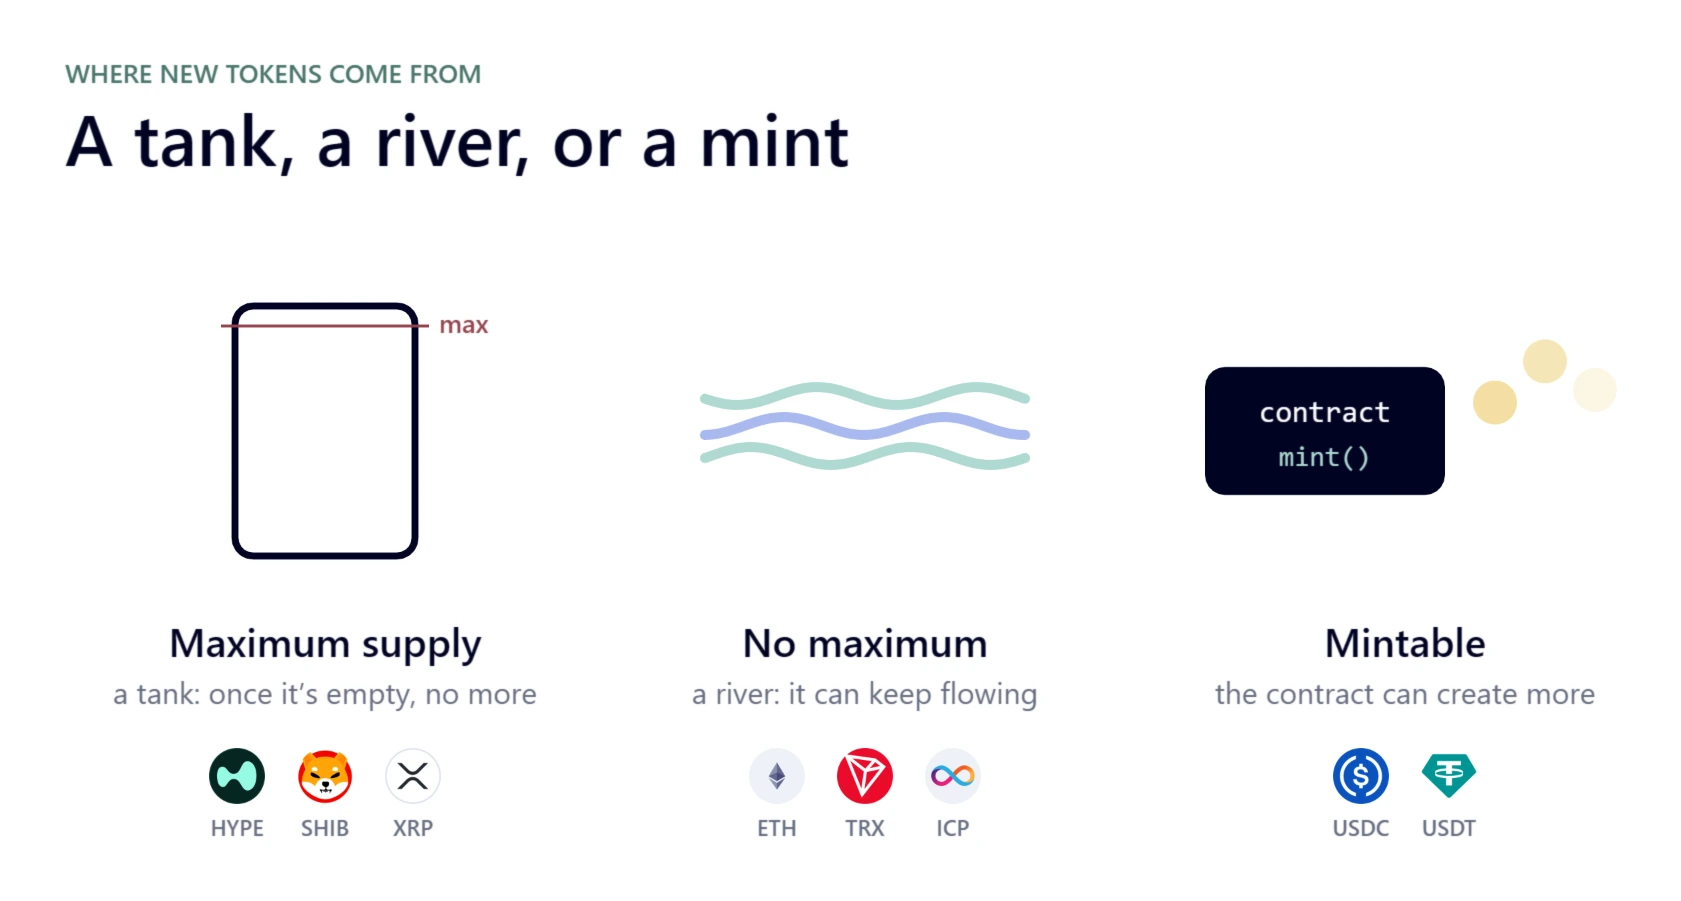
It also matters what feeds the tap. Tokens fall into three groups:
- A maximum supply, like a tank. There is a fixed number of tokens. Once the tank is empty, no new ones can be created. Examples: HYPE, SHIB, XRP.
- No maximum, like a river. New tokens can keep flowing for as long as the network’s rules allow. Examples: ETH, TRX, ICP.
- Mintable. Whoever controls the token’s contract can create new ones. Examples: the stablecoins USDC and USDT, whose issuers mint new tokens.
Ethereum: a record supply after 4.6 million burned
Ethereum has no fixed maximum supply, so its tap is a river. Here is its supply since 2021, with the ETH burned each day underneath.
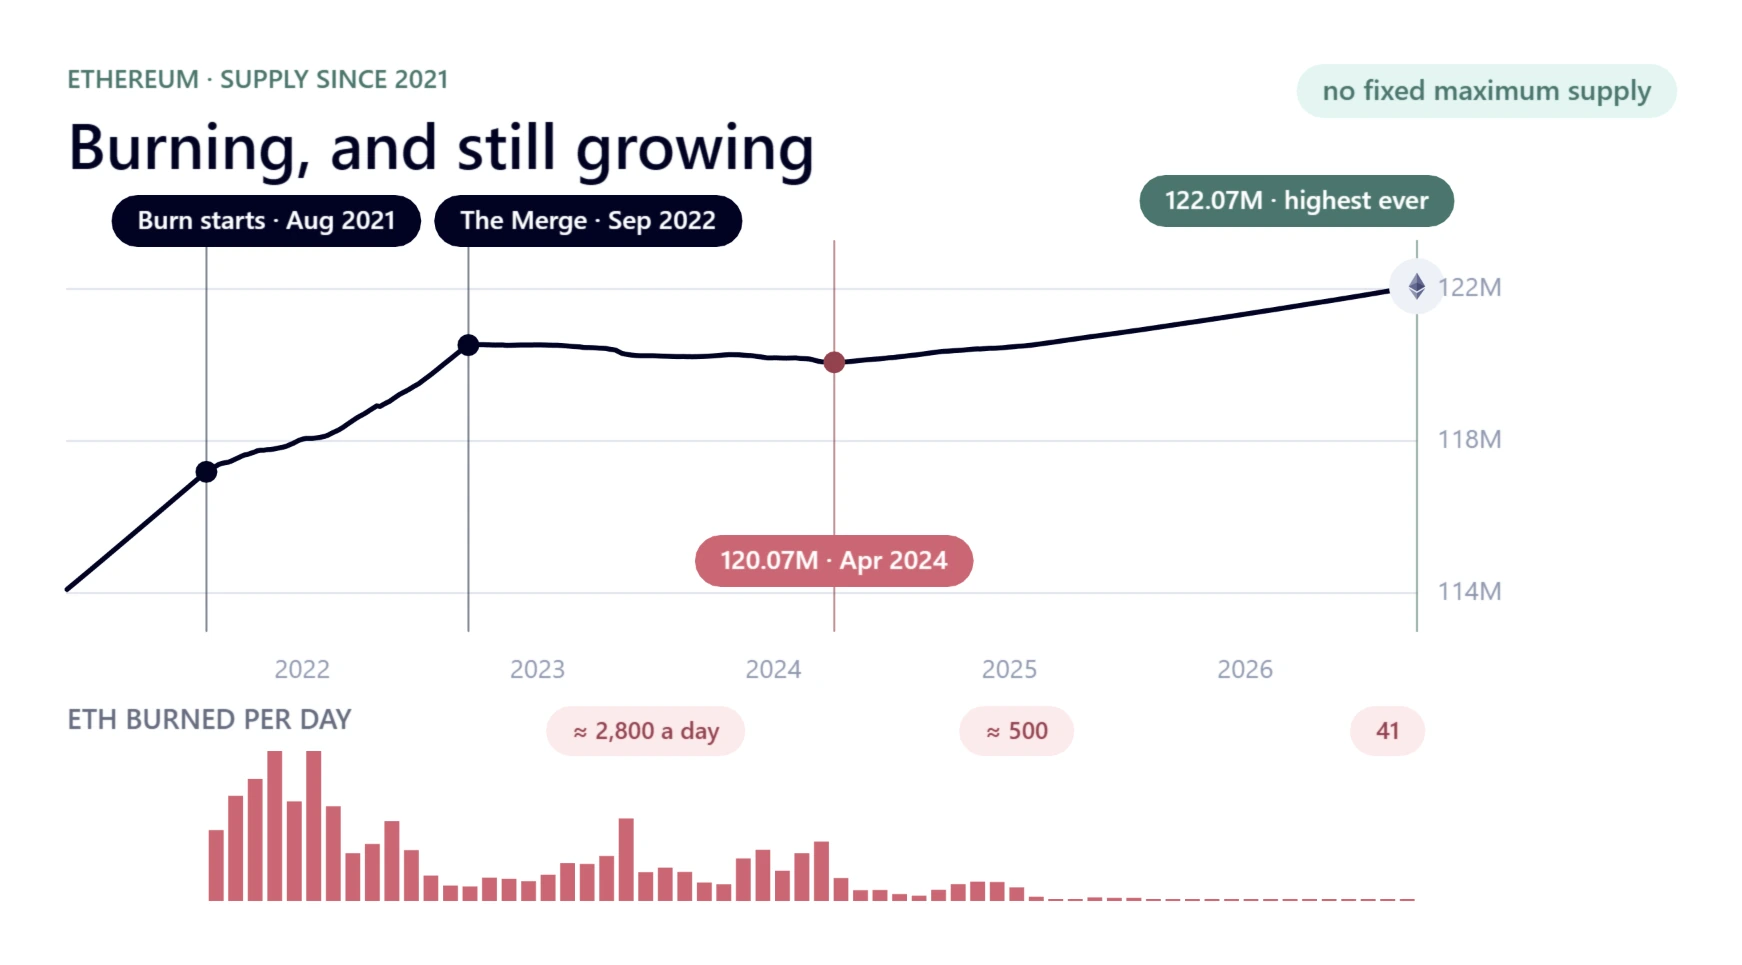
Read it from left to right:
- August 2021: the burn starts. But new ETH was still being created faster than it was burned: about 13,000 ETH a day was issued before the Merge, against about 6,461 burned. So the supply kept rising, from about 117.19 million ETH at London to 120.52 million at the Merge.
- September 2022: the Merge. It cut the amount of new ETH by about 88%. For a while, burns were bigger than issuance, and the supply actually shrank, down to about 120.07 million on 4 April 2024.
- Then the burn slowed. It averaged about 2,800 ETH a day from September 2022 to March 2024, around 500 a day from March 2024 to September 2026, and just 41 a day over the last 30 days.
- Today: the tap wins again. With the drain that small, Ethereum’s supply is about 122.07 million ETH, the highest it has ever been.
That is how both facts from the start are true: more than 4.6 million ETH burned, and a record supply.
Hyperliquid: a tank that is still being released
HYPE is different. It has a maximum supply of one billion tokens, so its tap is fed by a tank that can’t be refilled.
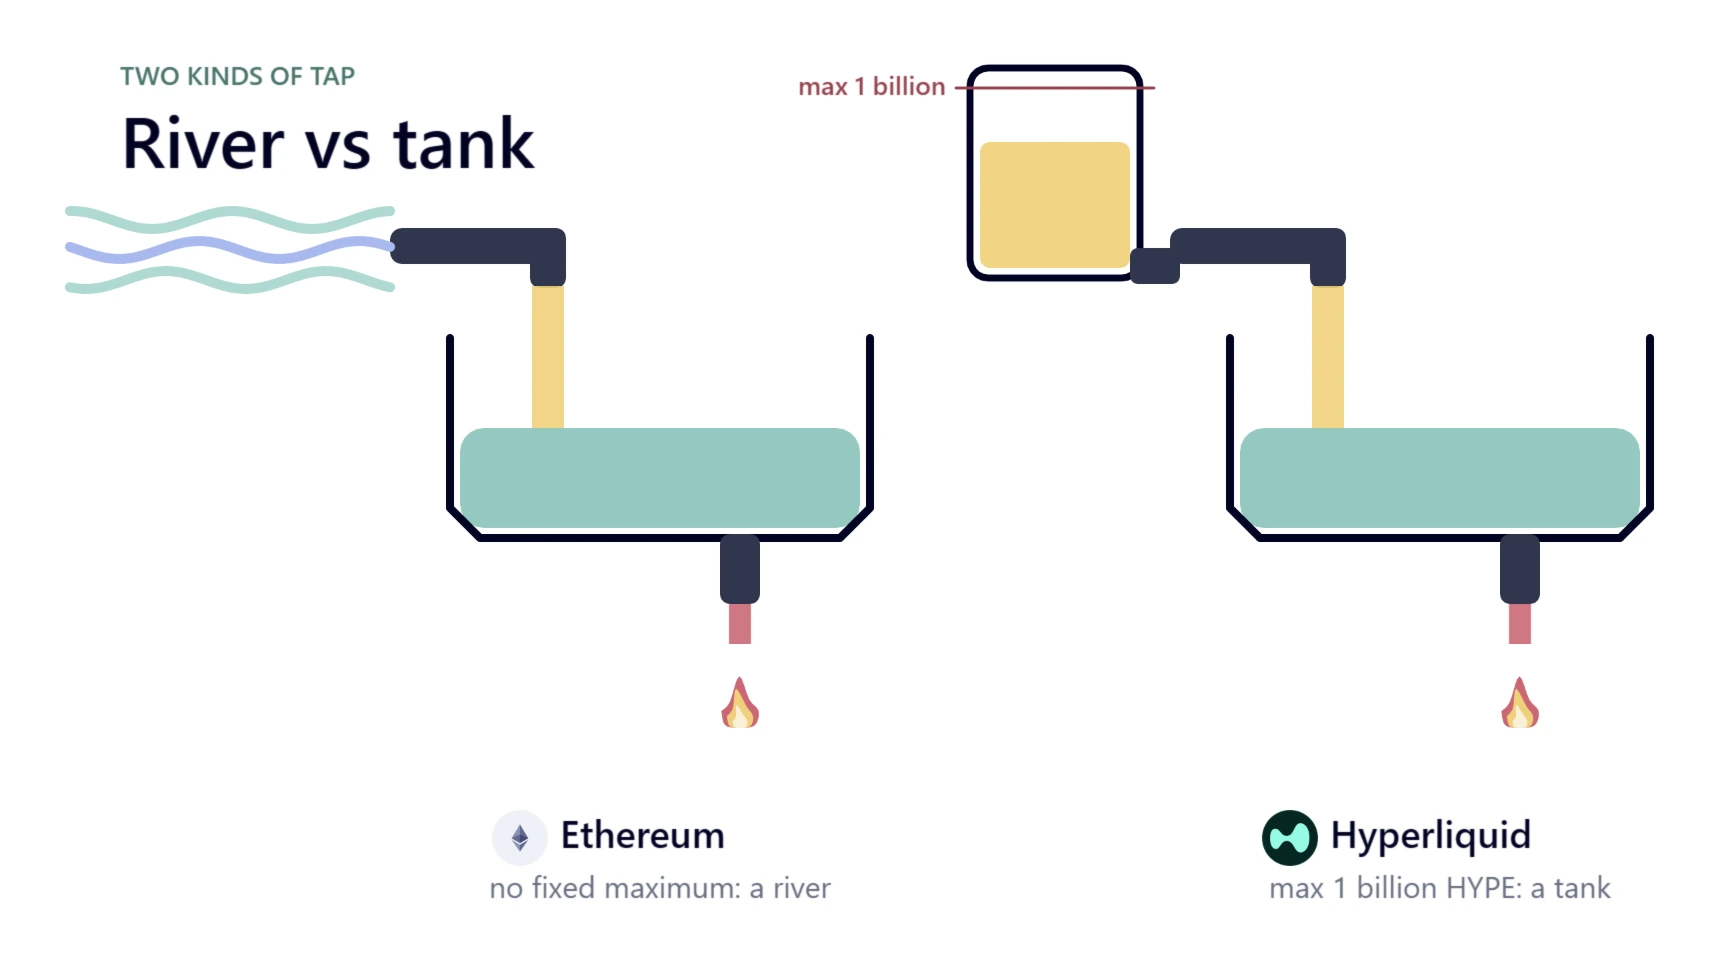
A tank doesn’t mean the tap is closed, though. HYPE burns about 23 thousand tokens a day, and new HYPE is still being released from the tank:
- Staking rewards come from a reserve of future tokens. In Hyperliquid’s own example, with 400 million HYPE staked, rewards are about 2.37% a year. That’s roughly 26 thousand HYPE a day, about as much as the burn.
- Core contributor tokens, 23.8% of the supply, were locked for a year after the launch on 29 November 2024. They’re being released over the next few years; the Hyper Foundation says most vesting schedules finish between 2027 and 2028.
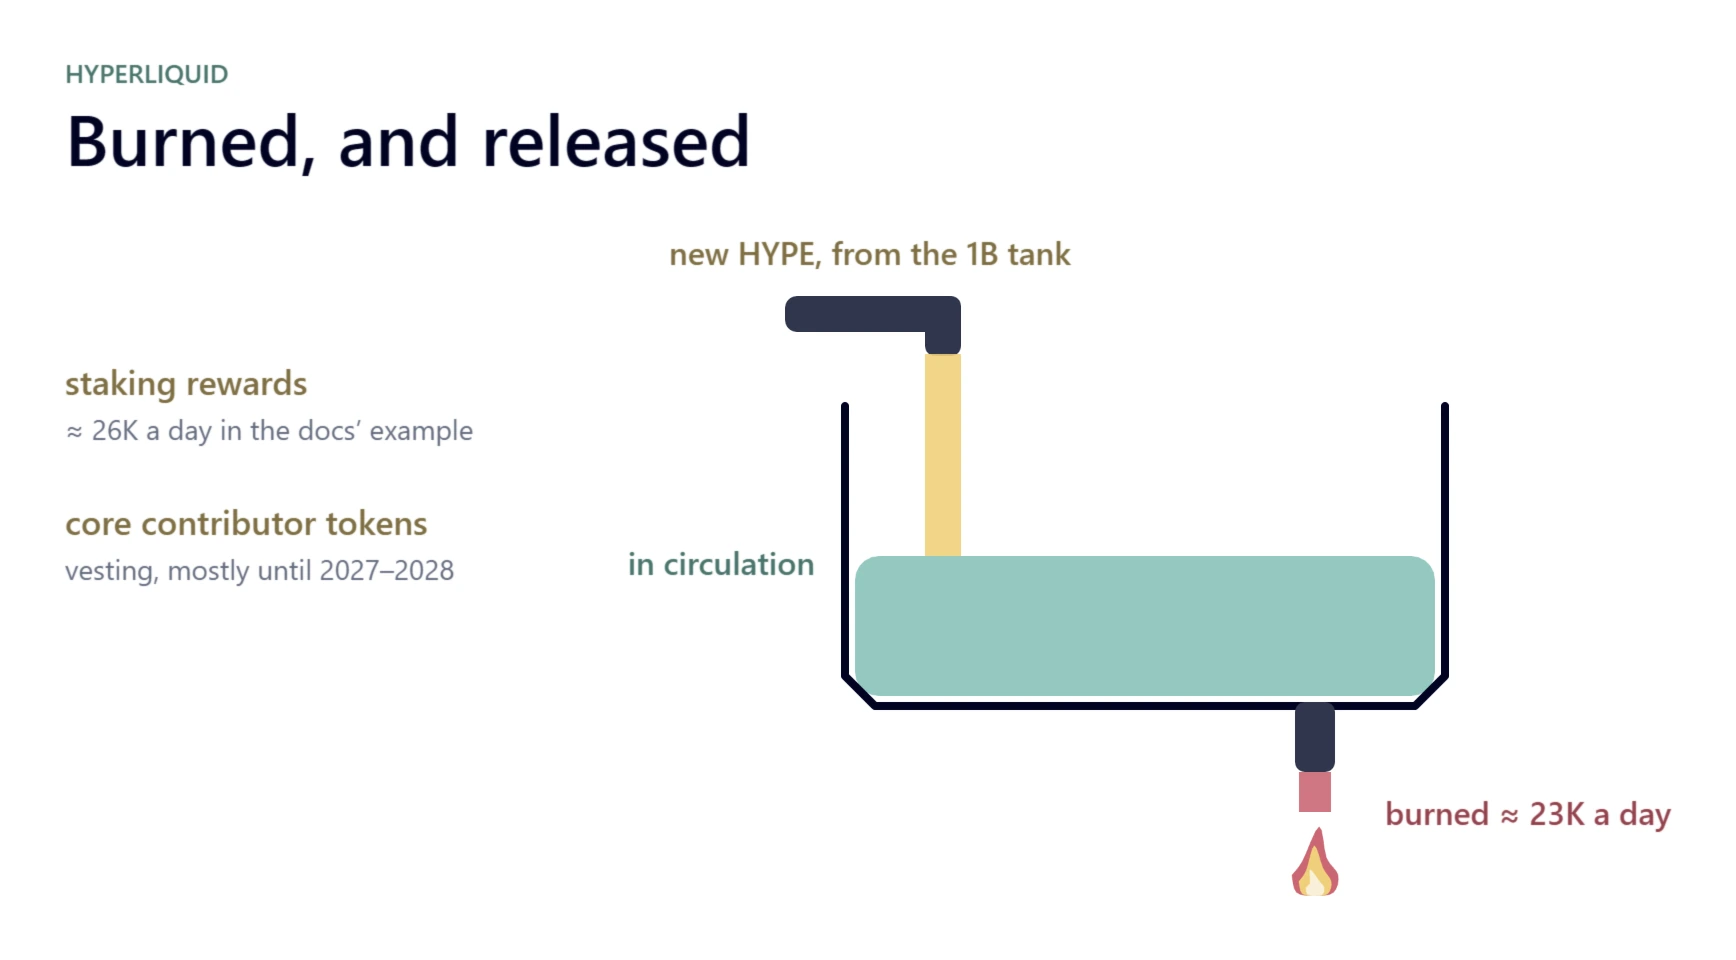
A burn alone can’t tell you if the supply is shrinking. Always look at both sides: how much is burned, and how much is created.
How big is a burn?
Big numbers can be misleading. One billion tokens sounds like a lot. From a supply of 500 trillion, it’s just 0.0002%.
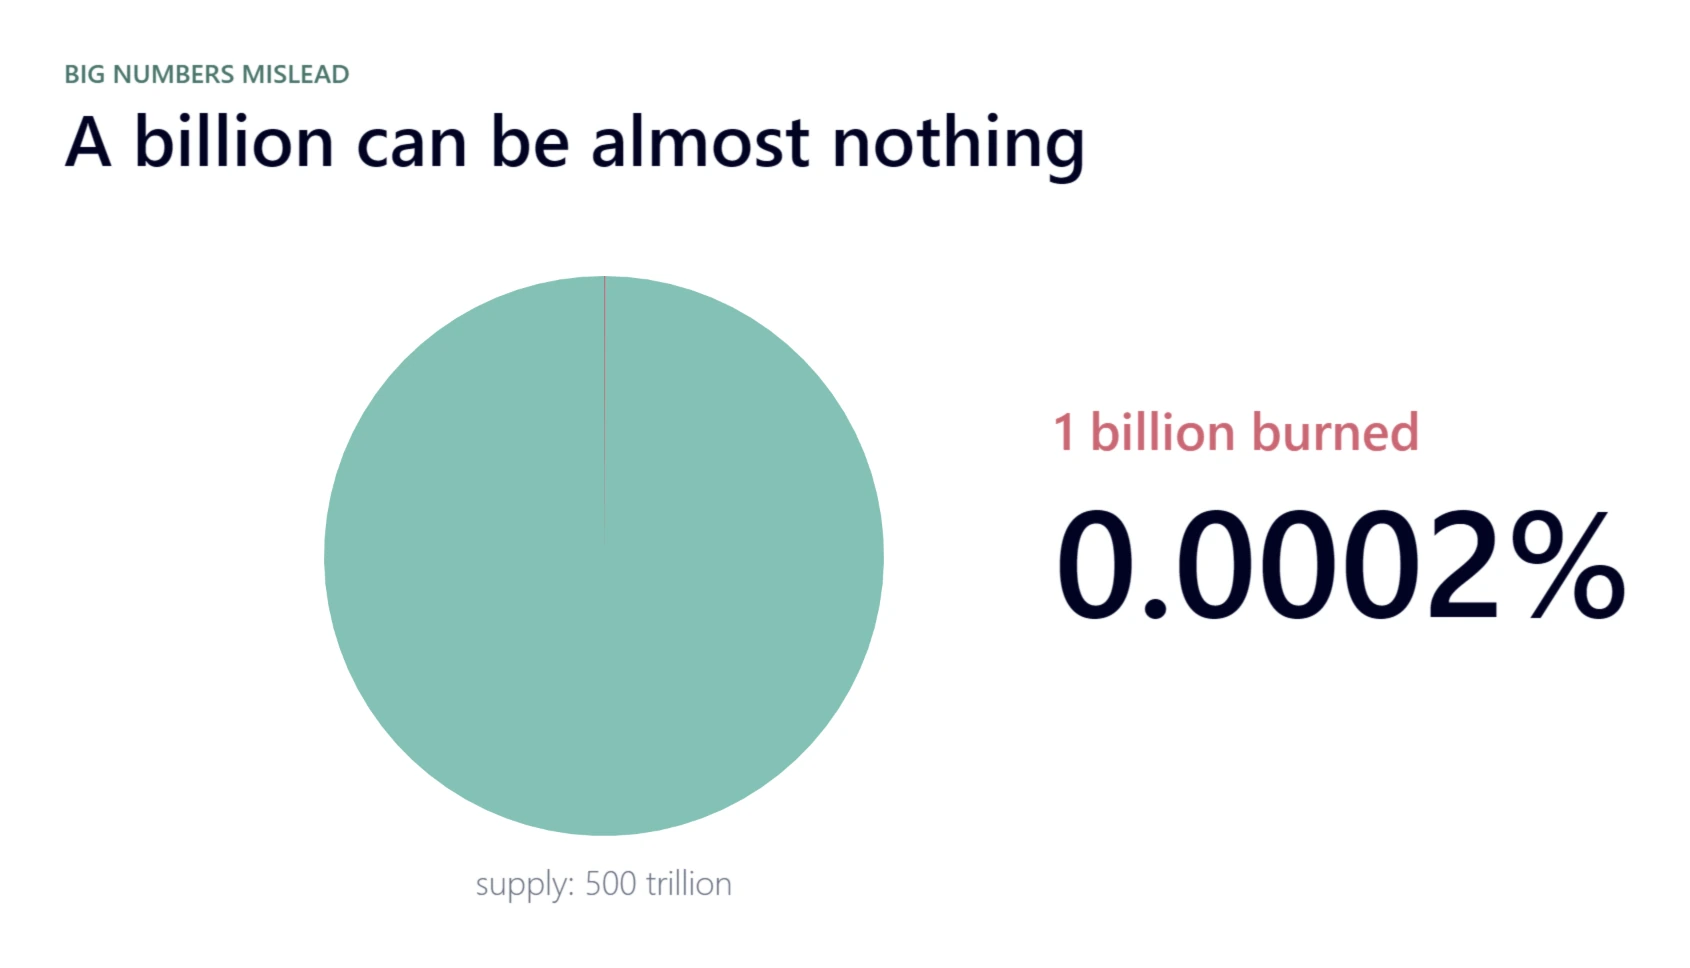
That’s why you compare a burn with the supply. The result is the share of the tokens that’s gone for good, and you can compare it across any token, however big its numbers are.
But which supply? Today’s supply has already shrunk from the burns, so it makes a burn look bigger. Take Shiba Inu: its 410.76 trillion SHIB burned is about 70% of today’s supply of 589.50 trillion, but only 41% of all the SHIB that ever existed, 1,000 trillion.
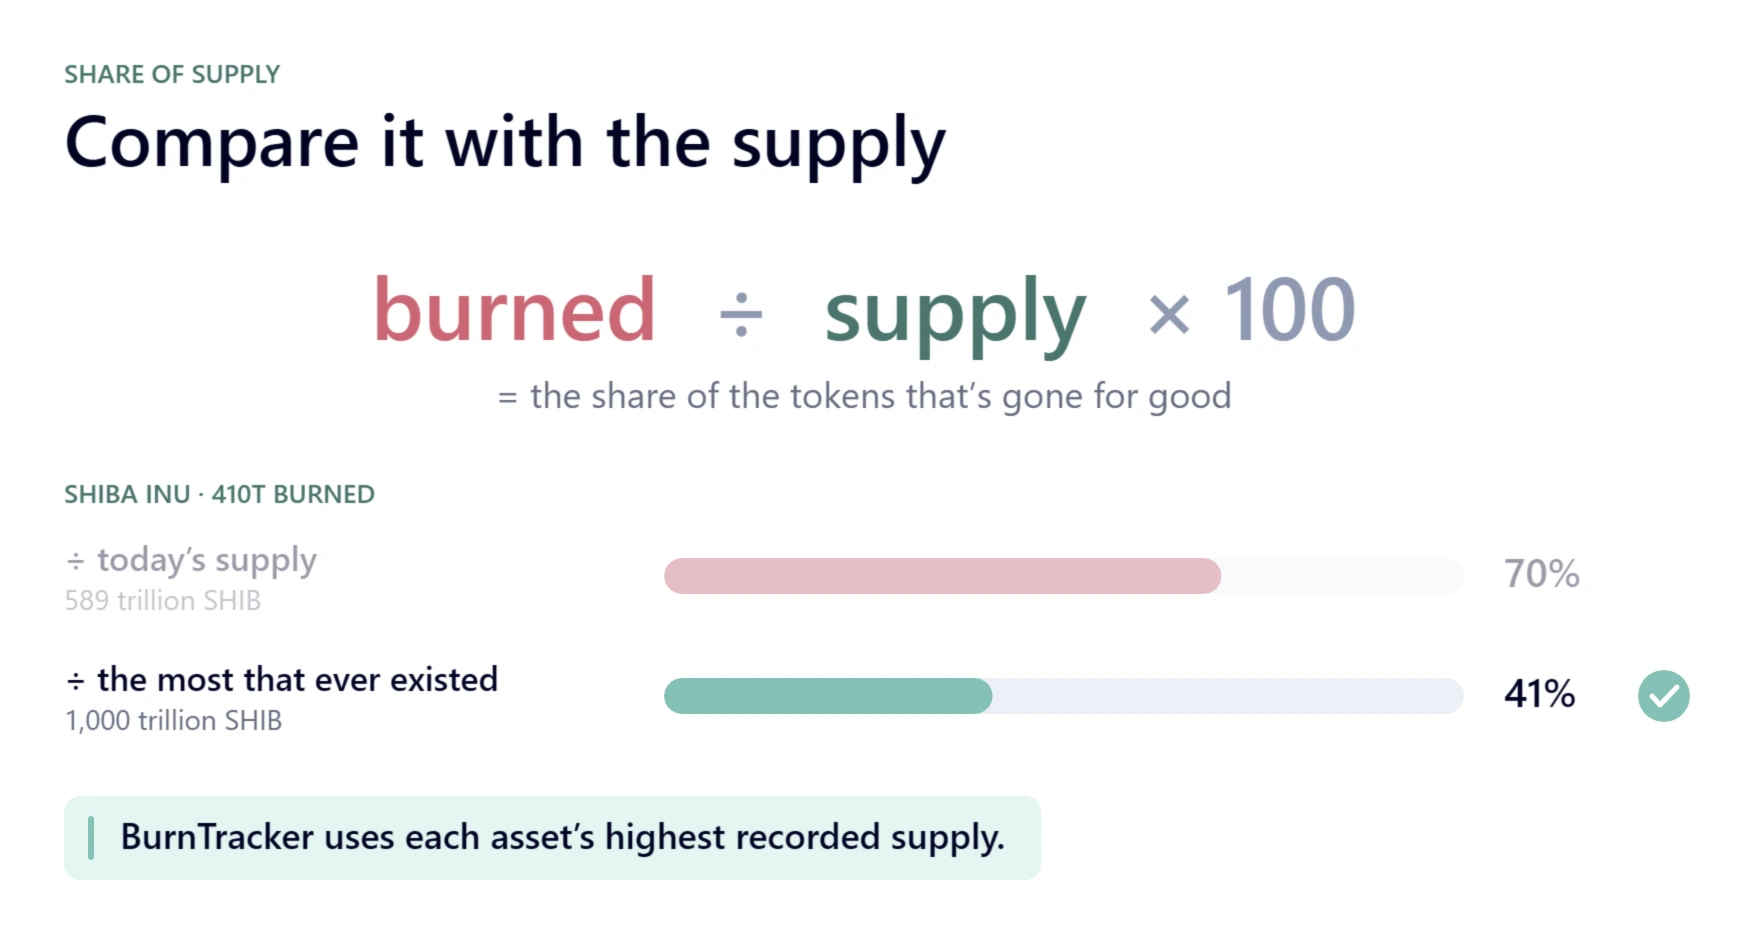
That’s why BurnTracker uses each asset’s all-time peak supply: the most tokens that ever existed at once. For a token with a fixed supply, that’s the amount created at launch. For a changing supply, it’s the highest supply on record. It doesn’t shrink when tokens burn, so every asset is measured the same way.
Here is how the tracked assets compare, as of 25 September 2026. At the top is Shiba Inu, with about 41% burned, then TRON with about 18%, LEO with 8% and Luna Classic with nearly 7%. Hyperliquid is at about 4.8%, Ethereum at 3.8%, Internet Computer at half a percent, and XRP at just 0.01%.
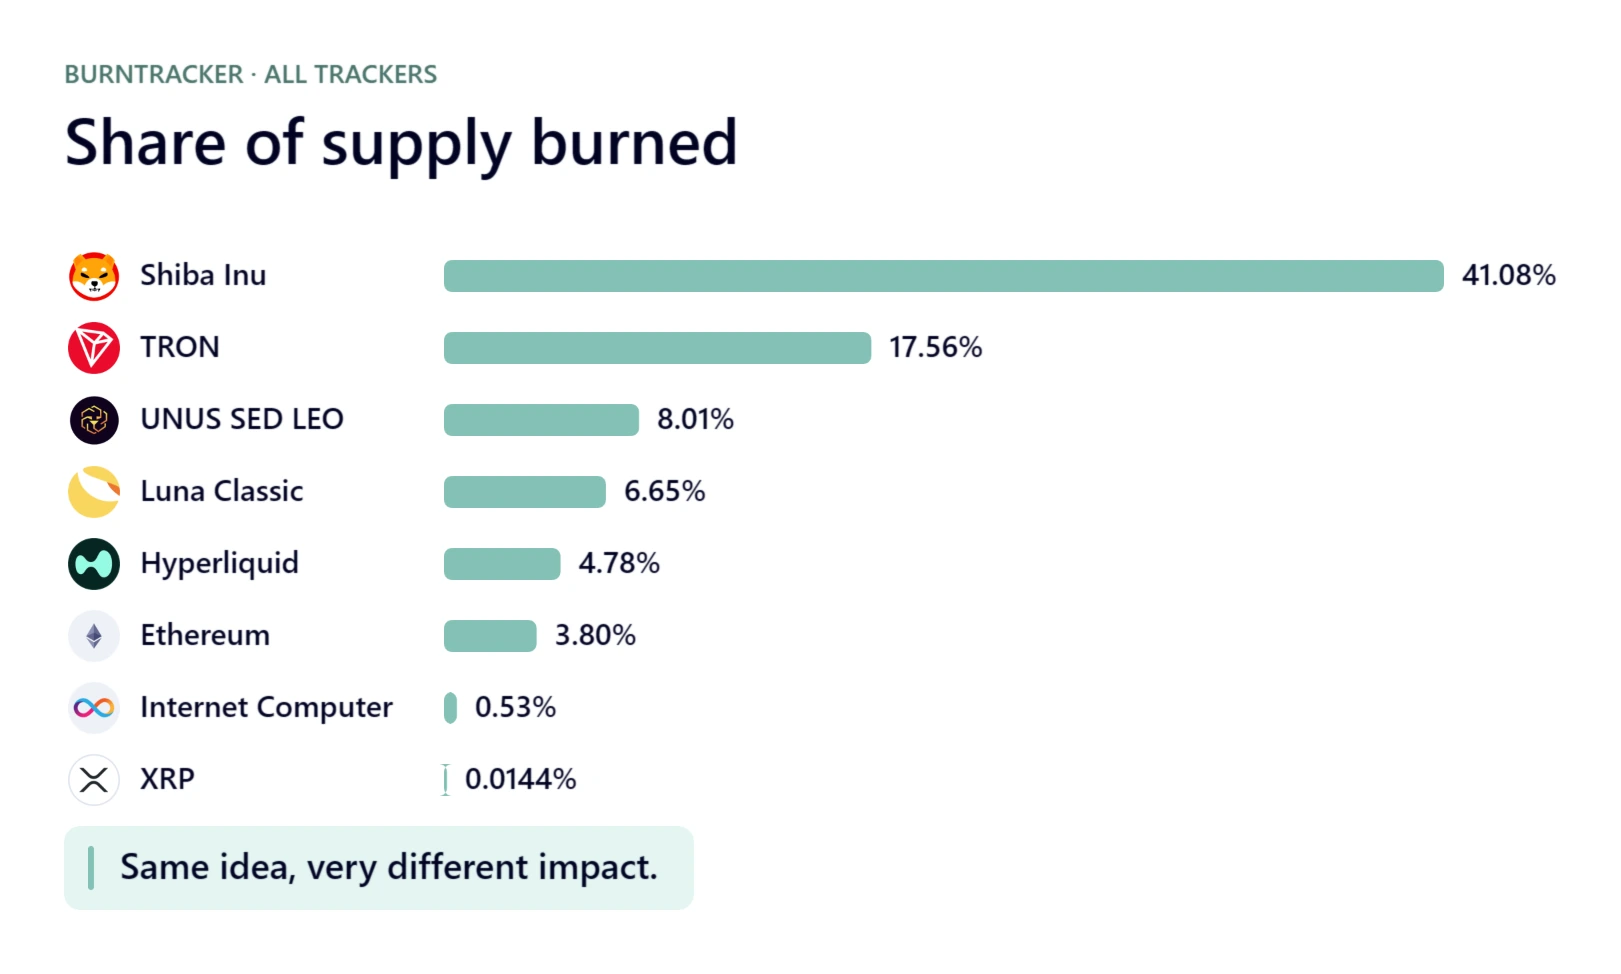
Same idea, very different impact. But a percentage isn’t the whole story either. In dollars, at today’s prices, the ranking changes: Ethereum’s burned ETH is worth about $12.5 billion, more than five times Shiba Inu’s $2.4 billion. And almost all of Shiba Inu’s 41% comes from that one transaction by Vitalik Buterin, not from steady burning.
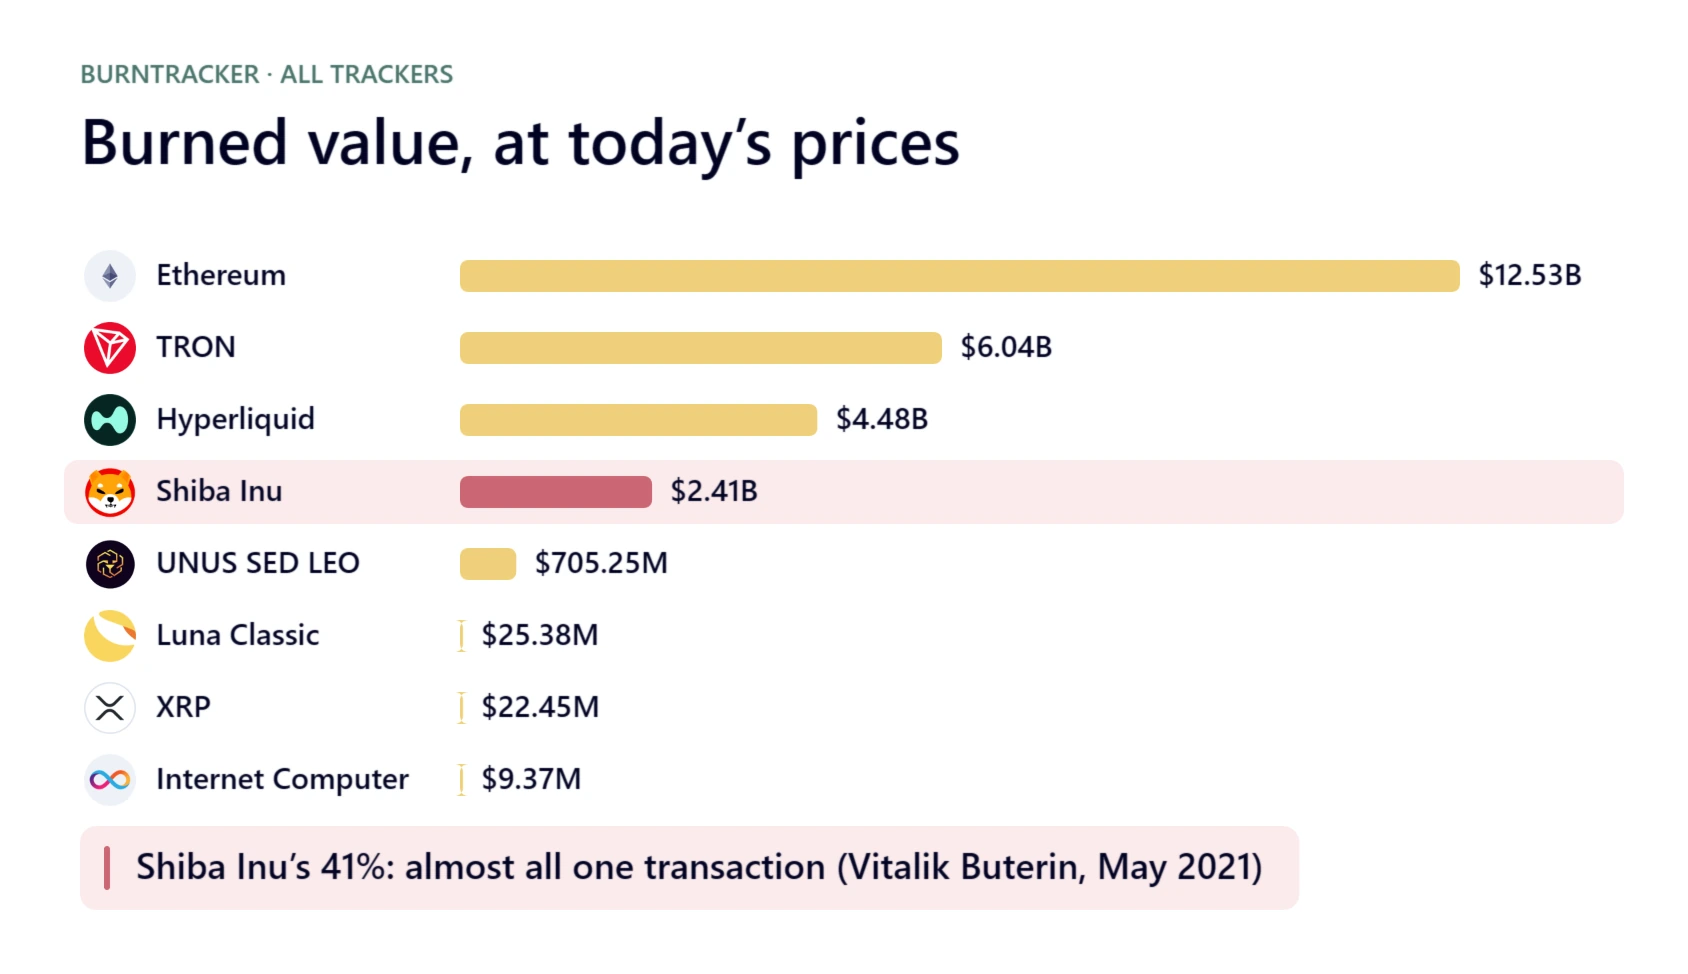
| Asset | Share of all-time peak supply burned | Burned value at today’s price |
|---|---|---|
| Shiba Inu (SHIB) | 41.08% | $2.41B |
| TRON (TRX) | 17.56% | $6.04B |
| UNUS SED LEO (LEO) | 8.01% | $705.25M |
| Luna Classic (LUNC) | 6.65% | $25.38M |
| Hyperliquid (HYPE) | 4.78% | $4.48B |
| Ethereum (ETH) | 3.80% | $12.53B |
| Internet Computer (ICP) | 0.53% | $9.37M |
| XRP | 0.0144% | $22.45M |
What a burn can’t tell you
There is one thing a burn total can’t tell you. It tells you how many tokens are gone. It can’t tell you what the remaining tokens will be worth.
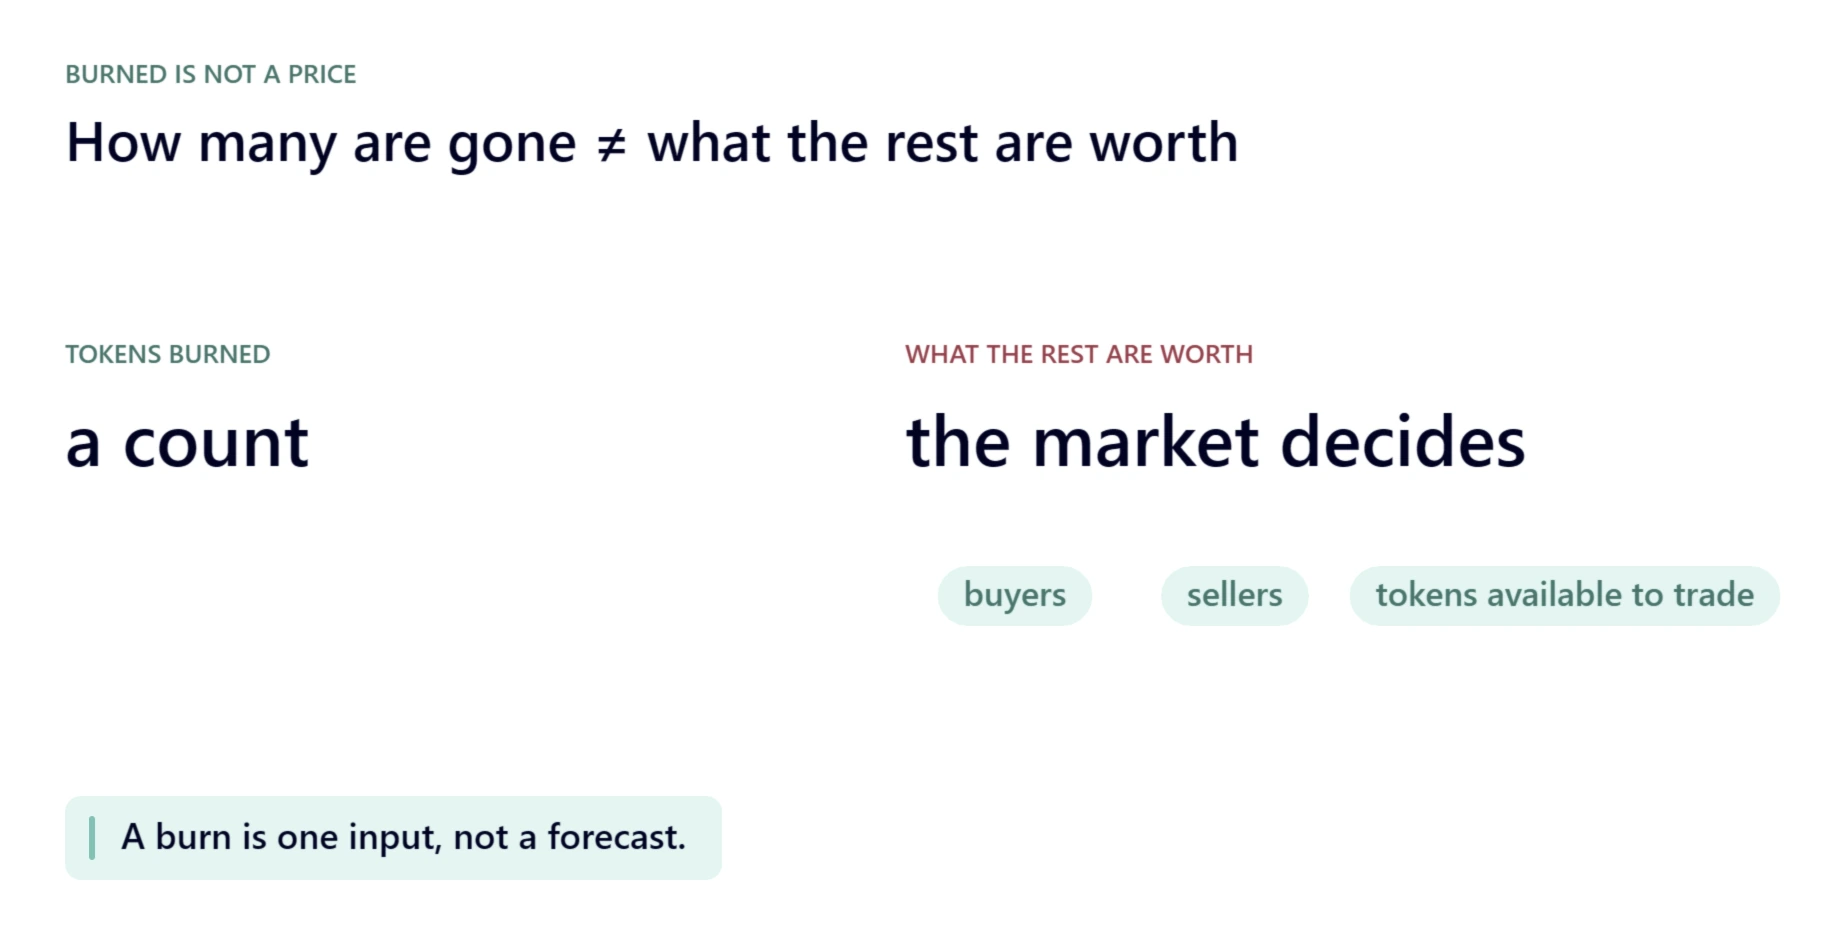
Price also depends on buyers, sellers, and how many tokens are available to trade. A burn is one input, not a forecast. For more on this, read What a token burn actually changes.
Check it yourself
You don’t have to take anyone’s word for a burn, including ours. Every burn leaves a record on the blockchain that anyone can look up. Here is the Shiba Inu burn from May 2021, as BurnTracker records it.
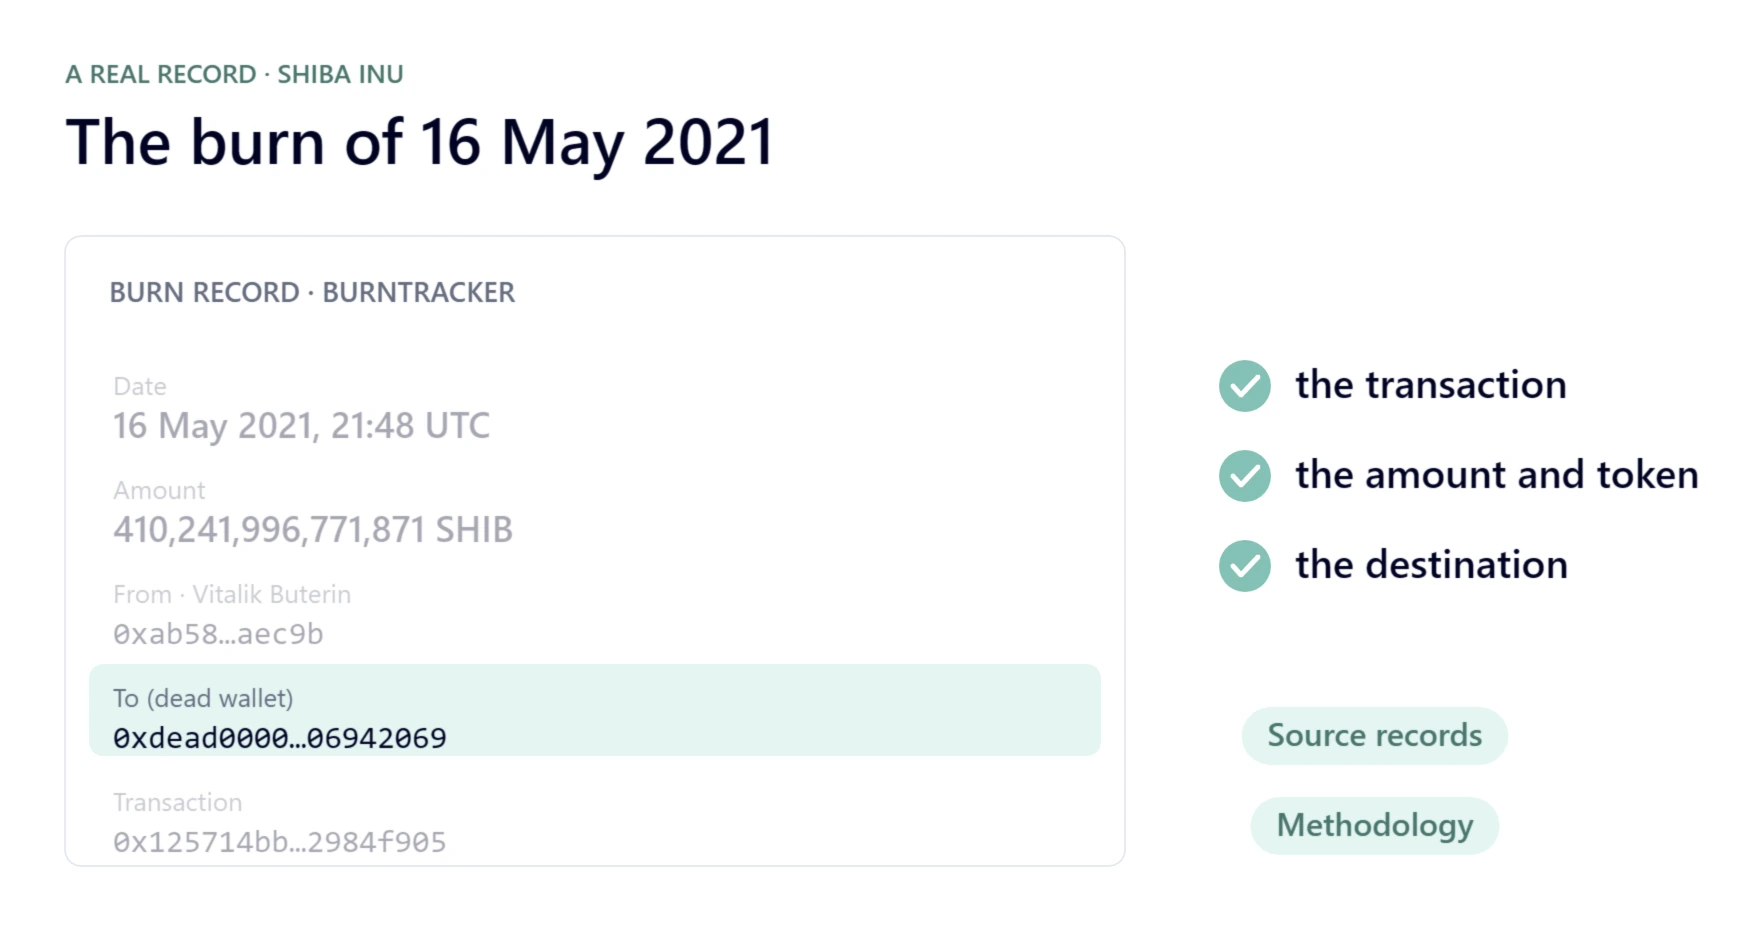
- The transaction. Every transaction has a unique hash, so you can look it up on a block explorer. This one is 0x125714bb…2984f905 on Etherscan.
- The amount and the token. Check that the tokens moved are the real token, from its official contract (for SHIB, 0x95ad61b0…c4ce), not a copy with the same name. And mind the decimal places: raw data often counts in a token’s smallest units.
- The destination. It should be an address no one is known to have a key for, so nobody can move the tokens out again. Here it’s the dead wallet 0xdead0000…06942069.
Every total on BurnTracker lists the records behind it, and the methodology explains exactly what is counted. The SHIB records are on the SHIB tracker.
Bottom line
A token burn removes tokens for good. But what it means depends on how much is burned, how much is created, and how big the supply is. Check all three before you read anything into a burn total.
Track every burn, with its sources, at cryptoburntracker.com.
Informational only, not financial advice.Sources
All figures were read on 25 September 2026. Tracker totals change every few minutes; each figure is given “as of” that date.
- BurnTracker: ETH, SHIB and HYPE trackers, the asset comparison, and the methodology. Prices: CoinGecko, in BurnTracker’s market snapshot.
- Ethereum: EIP-1559; ethereum.org on accounts, gas and fees, ETH issuance and ETH.
- ETH supply: Coin Metrics Community data (SplyCur, daily), licensed CC BY-NC 4.0, charted and rounded by cryptoburntracker.com.
- Shiba Inu: Etherscan records of the SHIB contract, Vitalik Buterin’s address and the 16 May 2021 burn; the India Covid-Crypto Relief Fund; The Shib Daily.
- Hyperliquid: docs on fees and the Assistance Fund and staking; Hyper Foundation, HYPE Genesis (28 November 2024).
- Supply types: xrpl.org (XRP), TRON developer docs, Internet Computer docs, Circle (USDC), Tether (USDT).